



Low latency Java is the practice of engineering JVM applications so that response times stay in the microseconds rather than milliseconds, primarily by eliminating garbage collection pauses, avoiding lock contention, and controlling memory layout. Techniques such as zero-GC design, off-heap data structures, and the LMAX Disruptor pattern make sub-100 microsecond, and even sub-10 microsecond, latency achievable in production. This guide walks through the factors that cause latency, the techniques that fix them, and the libraries that make them practical, including Chronicle Queue, Disruptor, and Aether-IPC, plus how VideoSDK's real-time communication SDKs complement latency-critical Java backends.
Introduction: Why Microseconds Matter
A high-frequency trading firm that responds 50 microseconds faster than its competitor captures the trade. A multiplayer game server that adds 20 milliseconds of jitter loses players. An IoT platform processing millions of sensor events per second falls behind the moment its processing loop stalls for a garbage collection pause. In all of these domains, latency is not a nice-to-have metric, it is the product.
Java was not originally designed for these workloads. The garbage-collected heap, the JIT compiler that optimizes code while it runs, and the abstraction layers over memory all introduce variability. Yet in 2026, Java runs some of the fastest trading systems in the world, because engineers learned how to strip out the sources of unpredictability.
This article covers what low latency actually means on the JVM, the key factors that influence Java latency, the techniques that push systems into the microsecond range, the libraries that implement those techniques for you, and the practical steps and pitfalls of putting it all into production. By the end, you will have a complete mental model of how to build, measure, and monitor a low latency Java system.
Understanding Low Latency Java Applications
Low latency Java is defined as Java engineering that targets consistent, predictable response times at the microsecond scale, rather than the millisecond scale typical of general-purpose applications. It works by removing the sources of pause and jitter in the JVM: garbage collection, lock contention, cache misses, and OS scheduling interference.
The critical distinction is between average latency and tail latency. A system with a 20 microsecond average can still be unusable for trading if one request in a thousand takes 40 milliseconds because of a GC pause. That is why low latency engineers obsess over the p99 and p99.9 percentiles, the latency thresholds that 99 percent and 99.9 percent of requests stay under. A p99.9 of 50 microseconds means the worst one-in-a-thousand request still completes in 50 microseconds.
Typical targets depend on the domain. Sub-100 microseconds is a common goal for exchange gateways and matching engines. Sub-10 microseconds is the territory of the fastest order paths, where every nanosecond of code path is accounted for. These targets are challenging in Java because the JVM's defaults are tuned for throughput, not for consistency. A standard garbage collector can pause a trading application for tens of milliseconds at exactly the wrong moment. Achieving microsecond consistency requires deliberately restructuring how the application allocates memory, synchronizes threads, and lays out data.
Key Factors That Influence Java Latency
Five factors dominate the latency profile of any JVM application, and each one must be addressed before microsecond consistency is possible.
Garbage Collection Pauses and Allocation
Every object allocated on the Java heap eventually triggers collection work. Even collectors marketed as low-pause, such as ZGC or Shenandoah, introduce coordination overhead and occasional stalls. For sub-100 microsecond targets, the only reliable strategy is to stop allocating on the hot path entirely, so that the collector never has anything to do. Allocation rate is the single biggest predictor of GC-induced jitter.
JIT Compilation Warm-Up
The JVM interprets bytecode when your application starts, then compiles hot methods to native code over time through tiered compilation. During warm-up, the same code path can run 10 to 100 times slower than its steady-state performance. A freshly restarted trading server is measurably slower for seconds to minutes. Low latency systems pre-warm their hot paths before going live, or accept that early measurements are meaningless.
Memory Hierarchy and False Sharing
CPU cores fetch memory in 64-byte cache lines. When two threads write to different variables that happen to sit on the same cache line, the hardware forces cache coherence traffic between the cores, even though the threads never share data logically. This phenomenon, called false sharing, can degrade a hot counter by an order of magnitude. Data layout is a first-class latency concern.
CPU Scheduling and NUMA
The OS scheduler can migrate your thread between cores at any time, invalidating caches and introducing microseconds of delay. On multi-socket machines, non-uniform memory access (NUMA) means a thread scheduled on the wrong socket pays a penalty for every memory access. Pinning latency-critical threads to specific cores, on the socket that owns their memory, removes both sources of jitter.
OS and Networking Stack Overhead
The kernel network stack adds tens of microseconds per packet through interrupts, syscalls, and buffer copies. Ultra-low latency systems bypass parts of it with kernel-bypass networking, busy-polling sockets, and memory-mapped IPC instead of TCP loopback for intra-host communication.
Techniques for Achieving Ultra-Low Latency
The techniques below are the standard toolkit for microsecond-level Java. They are cumulative: the biggest wins come from combining them.
Zero-GC Design with Off-Heap Memory
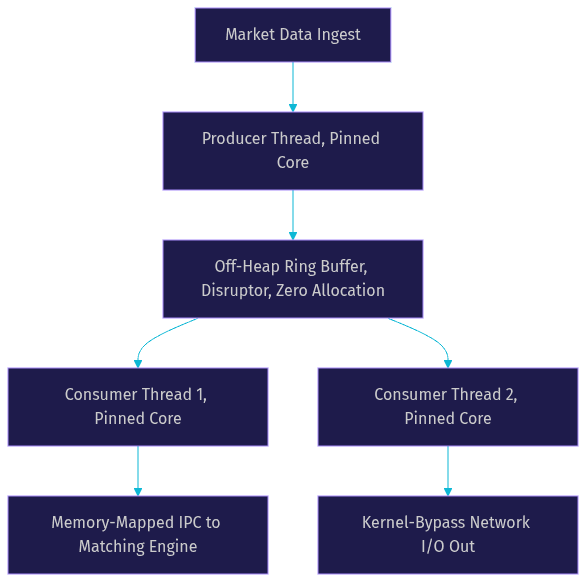
Zero-GC design means the hot path performs no heap allocation at all. Data lives in pre-allocated, off-heap memory, either direct byte buffers or memory-mapped files, managed with explicit offsets rather than object references. Objects are allocated once at startup, pooled, and reused forever. The JVM's Epsilon garbage collector, a no-op collector, can then be enabled to guarantee that any accidental allocation fails fast during testing rather than causing a pause in production. Off-heap structures also give you control over memory layout, which heap objects never do.
Lock-Free Algorithms and the Disruptor Pattern
Synchronized blocks and standard queue implementations cause threads to block, context-switch, and convoy behind each other. Lock-free algorithms use atomic memory operations so that threads make progress without ever waiting on each other. The LMAX Disruptor pattern is the canonical example: a pre-allocated ring buffer where producers claim slots via a single atomic sequence counter and consumers track their position independently. It passes messages between threads in tens of nanoseconds with no locks and no allocation.
Memory-Mapped Files for IPC
For inter-process communication on the same host, memory-mapped files let two JVMs share a region of memory directly. A writer appends records to the mapped region and a reader tails it, with the operating system handling visibility. This removes serialization, socket, and syscall overhead entirely, and it gives you persistence for free because the data is a file. Chronicle Queue and Aether-IPC are built on this foundation.
Cache-Line Padding and Thread Affinity
To prevent false sharing, hot mutable fields are padded so that each one occupies its own 64-byte cache line. To prevent scheduling jitter, latency-critical threads are pinned to dedicated cores using thread affinity libraries, isolating them from other work and from each other. On NUMA hardware, the pinned core is chosen on the socket that owns the memory the thread accesses.
SIMD with the Vector API
The Java Vector API lets the compiler generate single-instruction-multiple-data instructions, processing multiple data elements per CPU cycle. For latency-critical computations such as risk calculations or checksums over market data, vectorized code can cut per-item processing time several-fold compared to scalar loops.
The diagram below shows how these techniques compose into a typical low latency pipeline:
Low Latency Java Libraries and Tools
You do not have to build all of this from scratch. A mature ecosystem of low latency Java libraries implements these patterns, battle-tested in trading systems.
Chronicle Queue
Chronicle Queue is a persisted, off-heap, memory-mapped queue that achieves microsecond-level write and read latency while keeping every message durable on disk. It is the de facto standard for event sourcing and inter-process messaging in trading systems, because it behaves like a journal that two processes can share at memory speed.
LMAX Disruptor
The LMAX Disruptor is the open-source lock-free ring buffer that pioneered the pattern described above. It handles millions of messages per second between threads with nanosecond-scale handoff latency, and it remains the foundation for intra-process messaging in countless low latency systems.
Aether-IPC
Aether-IPC uses memory-mapped files to achieve sub-microsecond round-trip communication between JVM processes on the same host. It is designed for the tightest IPC paths where even Chronicle's durability guarantees are more than needed.
VeloceEngine
VeloceEngine is an ultra-low latency order-book matching engine built on the LMAX Disruptor. It demonstrates how the Disruptor pattern composes into a full domain application, and serves as a reference architecture for anyone building event-driven engines.
Lattice
Lattice is a bounded graph runtime with explicit back-pressure and NUMA-aware execution. It suits streaming workloads where you want deterministic throughput behavior rather than unbounded queues that silently grow and then stall.
| Library | Latency Range | Typical Use Case | Notes |
|---|---|---|---|
| Chronicle Queue | Microseconds, persisted | Cross-process event journaling | Memory-mapped files |
| LMAX Disruptor | Nanoseconds to microseconds | Intra-process messaging | Lock-free ring buffer |
| Aether-IPC | Sub-microsecond | Same-host JVM-to-JVM IPC | Memory-mapped, no persistence |
| VeloceEngine | Microseconds | Order-book matching | Built on Disruptor |
| Lattice | Microseconds | Streaming graph processing | NUMA-aware, back-pressure |
The matrix below maps each library to its core latency technique:

Practical Implementation Steps
Moving an existing Java service to microsecond latency is a sequence of measurable steps, not a rewrite. Work through them in order.
Step 1: Profile Current Latency
Start by measuring where you actually are. Use Java Flight Recorder or async-profiler to capture latency histograms, allocation rates, and GC pause distributions under realistic load. You cannot optimize what you have not profiled, and the profile usually reveals that one or two sources, often allocation and lock contention, dominate everything else.
Step 2: Choose a Zero-GC Strategy
Decide how the hot path will avoid allocation, then configure the JVM to enforce it. During testing, enable the Epsilon no-op collector through the JVM's experimental options so that any accidental allocation causes an immediate out-of-memory failure rather than a silent pause. This turns allocation discipline from a hope into a hard guarantee.
Step 3: Move Data Off-Heap
Replace heap objects on the hot path with off-heap containers: direct buffers, memory-mapped regions, or library-provided off-heap collections. Pre-allocate everything at startup and reuse it. Describe your data layout explicitly, with fixed offsets, so that serialization becomes a simple memory copy.
Step 4: Integrate a Lock-Free Queue
Wire a Disruptor ring buffer or a Chronicle Queue into the processing flow so that stages of your pipeline hand off work without locks. Producers claim slots, consumers process them in sequence, and no thread ever blocks waiting for another.
Step 5: Apply Thread Affinity
Pin each latency-critical thread to its own core, on the correct NUMA node, using the JVM's thread affinity support or a dedicated affinity library. Isolate those cores from other system work where the OS allows it.
Step 6: Benchmark and Verify
Use JMH, the Java Microbenchmark Harness, to measure p99 and p99.9 latency for the hot path, with proper warm-up so JIT effects are excluded from the numbers. Compare against your Step 1 baseline. If tail latency has not improved, return to the profile before adding more complexity.
Common Pitfalls and How to Avoid Them
Even experienced teams hit these traps when pursuing low latency Java.
Over-optimistic allocation-free assumptions. Teams declare a path allocation-free without measuring, then discover hidden allocations from autoboxing, string formatting, or iterator objects. Always verify with an allocation profiler, and use the Epsilon collector in testing to catch violations mechanically.
Ignoring warm-up time. Benchmarks run in the first seconds of a JVM's life measure the interpreter, not your code. Either warm up thoroughly before recording numbers, or explicitly report cold and warm figures separately. Misleading warm-up-free benchmarks have justified more bad architecture decisions than any other latency mistake.
Forgetting background JVM activity. GC threads, JIT compiler threads, and periodic JVM housekeeping can steal CPU from your pinned threads. Configure the JVM to keep these activities off the cores your latency-critical threads occupy.
Mis-aligned data structures causing false sharing. Two hot counters placed adjacently in memory can silently destroy performance. Pad or reorganize hot mutable fields so each owns a full cache line, and verify with a profiler that shows cache-level events.
Relying on the default OS scheduler. Without explicit affinity, the scheduler will migrate your threads mid-flight, invalidating caches at the worst moments. Real-time behavior requires explicit core assignment, not scheduler goodwill.
Monitoring and Observability in Production
Low latency systems need monitoring that does not itself introduce latency. Java Flight Recorder is the right foundation: it captures latency histograms, GC events, and thread-state changes with sub-microsecond overhead when configured with a small buffer and a long rotation period.
Export the metrics that matter to Prometheus or your platform of choice: latency percentiles at p50, p99, and p99.9, allocation rate, and any pause events. Set alerts on tail-latency spikes rather than averages, because averages hide exactly the events that hurt you. Keep logging on the hot path minimal or asynchronous, since a synchronous disk write can cost more than your entire latency budget. For teams building latency-sensitive real-time features such as live audio or video, pairing a tuned Java backend with a purpose-built real-time communication layer like VideoSDK's real-time communication SDKs keeps media delivery in the sub-300 millisecond range while your Java services handle the microsecond-critical business logic.
Definitions Glossary
Tail latency (p99/p99.9): The latency threshold that 99 or 99.9 percent of requests fall under. Low latency Java engineering targets these percentiles, not averages, because a single GC pause can make an average look fine while the worst cases are unusable.
Zero-GC design: An application architecture where the hot path performs no heap allocation, using pre-allocated and pooled objects or off-heap memory, so the garbage collector never has work to do and never pauses the application.
Off-heap memory: Memory managed outside the garbage-collected Java heap, accessed through direct buffers or memory-mapped files, giving explicit control over layout and lifetime at the cost of manual management.
LMAX Disruptor pattern: A lock-free messaging design using a pre-allocated ring buffer where producers and consumers coordinate through atomic sequence numbers, enabling nanosecond-scale handoff between threads without locks or allocation.
False sharing: A performance degradation that occurs when two threads write to different variables located on the same 64-byte CPU cache line, forcing cache coherence traffic between cores despite no logical data sharing.
Thread affinity: The practice of pinning specific threads to specific CPU cores, and on multi-socket machines to the correct NUMA node, to prevent scheduler migrations and keep memory access fast and predictable.
Key Takeaways
- Low latency Java means engineering for consistent microsecond-scale tail latency (p99 and p99.9), not for good averages, and garbage collection pauses are the primary enemy.
- The core techniques are cumulative: zero-GC design with off-heap memory, lock-free messaging with the Disruptor pattern, cache-line padding, thread pinning, and memory-mapped IPC.
- Mature libraries such as Chronicle Queue, LMAX Disruptor, and Aether-IPC implement these patterns for you, with latencies ranging from nanosecond handoffs to durable microsecond journaling.
- Always profile first with Java Flight Recorder or async-profiler, and verify improvements with JMH benchmarks that account for JIT warm-up.
- The trade-off is real: every microsecond you remove costs complexity, so measure your actual tail latency before deciding how far down this path to go.
Conclusion
Low latency Java in 2026 is a solved problem with a known toolkit: eliminate allocation on the hot path, move data off-heap, replace locks with the Disruptor pattern, pad your cache lines, pin your threads, and verify everything with honest tail-latency benchmarks. Each technique adds complexity, so the right stopping point depends on whether your domain demands sub-100 microseconds or can live comfortably at sub-millisecond. Start by profiling your current p99.9 with Java Flight Recorder, then try one library, such as Chronicle Queue or the Disruptor, and measure what changes. If you are also building latency-sensitive real-time features like live video or voice alongside your Java services, explore VideoSDK's documentation and grab a free tier at app.videosdk.live/login. What are you building with low latency Java? Drop a comment, I would love to hear what kind of latency target you are chasing.
Free $20 Balance for AI Voice Agents & Video Calls
FAQ