


WebRTC latency is the total delay between capturing a media frame on one device and rendering it on another, measured glass-to-glass across the entire media pipeline. For interactive applications, the target is sub-200 milliseconds. VideoSDK's network-adaptive streaming and globally distributed infrastructure help developers stay within that budget without managing TURN servers or SFUs manually.
WebRTC latency determines whether your video call feels like a face-to-face conversation or a walkie-talkie exchange. When a user speaks, the audio leaves their microphone, gets encoded, traverses the network, reaches the media server, gets routed to participants, decodes, and finally plays through speakers. Every step adds milliseconds. Those milliseconds add up.
If you are building a telemedicine platform, a remote robotics control system, or a competitive gaming stream, latency is not a nice-to-have metric. It is the difference between a usable product and an unusable one. The International Telecommunication Union recommends one-way latency below 150 milliseconds for acceptable interactive communication, and below 200 milliseconds as a practical ceiling before users notice degradation.
This article breaks down where WebRTC latency comes from, how to measure it accurately, and how to optimize across network, media, and signaling layers. Whether you are using raw WebRTC or a managed SDK like VideoSDK's video calling API, the principles are the same.
What Is WebRTC Latency and Why Does It Matter?
WebRTC latency is defined as the total time elapsed between a media frame being captured at the source device and that same frame being rendered on the receiving device. This end-to-end measurement, often called glass-to-glass latency, encompasses every processing step in between: camera capture, encoding, network transport, server routing, decoding, jitter buffering, and screen rendering.
WebRTC latency works by accumulating delay across each stage of the media pipeline. Unlike simple network latency, which measures only packet travel time, WebRTC latency includes processing overhead at both endpoints and any intermediary media servers. A single video frame might spend 5 milliseconds in capture, 10 milliseconds in encoding, 40 milliseconds in transit, 15 milliseconds in a jitter buffer, and 5 milliseconds in decoding before it reaches the renderer.
It is important to distinguish three related but distinct concepts. Latency is the one-way delay from source to destination. Round-trip time (RTT) is the time for a packet to travel to the destination and back, which WebRTC estimates using RTCP receiver reports. Jitter is the variation in packet arrival times, which forces receivers to buffer media and indirectly increases latency.
Human perception sets the practical thresholds. According to the ITU-T G.114 recommendation, one-way latency below 150 milliseconds is imperceptible to most users for conversational applications. Between 150 and 200 milliseconds, users begin to notice slight delays but can still communicate naturally. Above 200 milliseconds, conversations become awkward, with participants talking over each other. For applications like remote robotics or competitive gaming, the budget tightens further, often requiring sub-100 millisecond latency.
VideoSDK addresses WebRTC latency through network-adaptive streaming that automatically adjusts bitrate and resolution based on real-time bandwidth conditions, helping maintain low latency even on unstable connections.
Measuring WebRTC Latency
Accurate WebRTC latency measurement requires tracking delay at multiple points in the media pipeline, not just checking network ping times. The most comprehensive metric is glass-to-glass latency, which measures from the moment a camera sensor captures light to the moment the receiver's screen displays that frame. However, glass-to-glass measurement is difficult to instrument in production because it requires synchronized clocks across devices and access to hardware-level capture and render timestamps.
In practice, developers rely on several measurement approaches. The WebRTC Stats API, accessible through the getStats method on RTCPeerConnection objects, provides round-trip time estimates, jitter values, and packet loss data. Browser-based tools like chrome://webrtc-internals expose detailed graphs of these metrics in real time, making it possible to inspect individual media streams, codec bitrates, and candidate pair statistics during an active session.
When interpreting RTCStats reports, three values deserve close attention. The roundTripTime field on outbound RTP stream stats gives the current RTT estimate for a specific media stream. The totalRoundTripTime accumulates RTT over the session, useful for trend analysis. The jitter field on inbound RTP stream stats indicates the variation in inter-arrival time, measured in seconds, which directly influences how aggressively the jitter buffer must delay playout.
External tools complement browser internals. Network emulators on Linux let you simulate packet loss, latency, and bandwidth constraints during testing. Commercial monitoring platforms provide dashboards that aggregate RTCStats across thousands of sessions, correlating latency with geographic location, device type, and network conditions.
Key Metrics to Track
Round-trip time is the most accessible latency metric in WebRTC. It measures the time for an RTCP packet to reach the remote endpoint and return. RTT does not equal one-way latency, but dividing RTT by two gives a rough estimate of network delay in each direction. Keep in mind that asymmetric routing can make this approximation inaccurate.
Jitter buffer delay represents the time media spends waiting in the receiver's buffer before playback. The jitter buffer exists to smooth out packet arrival variation, but every millisecond of buffer adds directly to end-to-end latency. Configuring the minimum and maximum playout delay lets you trade off between latency and audio quality.
Codec processing time includes the time spent encoding and decoding each frame. Hardware-accelerated codecs like H.264 with NVENC or VideoToolbox typically process frames in under 10 milliseconds, while software-only VP9 encoding on a constrained device can take 30 milliseconds or more per frame.
Rendering delay is the time between a decoded frame being available and it actually appearing on screen. This depends on the display refresh rate, compositor scheduling, and GPU pipeline depth. On a 60 Hz display, rendering alone can add up to 16.7 milliseconds of latency per frame.
Latency Budget Breakdown
A WebRTC latency budget decomposes end-to-end delay into discrete pipeline phases, each with its own typical range and optimization levers. Understanding where your milliseconds go is the first step toward reducing them. Most production WebRTC applications operate with a total budget of 150 to 200 milliseconds for one-way latency, and every phase competes for a slice of that budget.
The capture phase, where the camera or microphone produces raw media, typically consumes 5 to 15 milliseconds. This depends on camera hardware, driver efficiency, and frame rate. High-end webcams with direct integration on Windows can capture in under 5 milliseconds, while mobile cameras with multiple processing layers may take 15 milliseconds or more.
Encoding is where raw frames become compressed packets. The codec choice and hardware acceleration availability dominate this phase. H.264 with hardware encoding usually takes 5 to 10 milliseconds. VP8 and VP9 in software can range from 10 to 30 milliseconds depending on resolution and CPU. AV1, while offering better compression efficiency, can be slower without dedicated hardware support, though real-time AV1 encoders are improving rapidly.
Network transport is the most variable phase, ranging from 20 to 80 milliseconds for typical intercontinental routes. Factors include physical distance, number of router hops, ISP peering quality, and whether traffic traverses a TURN server. Using geographically distributed TURN servers and edge-deployed SFUs can reduce this phase significantly.
The media server or SFU phase adds 5 to 30 milliseconds depending on server load, routing complexity, and whether simulcast or SVC layer switching is involved. A well-tuned SFU on dedicated hardware near both participants can process and forward packets in under 10 milliseconds.
The jitter buffer on the receiving side adds 5 to 30 milliseconds, sometimes more on unstable connections. This buffer absorbs network jitter but directly increases latency. Tighter buffer settings reduce latency at the cost of potential audio artifacts on lossy networks.
Decoding and rendering together typically add 7 to 25 milliseconds. Hardware-accelerated decoding is faster, and display refresh rate determines the minimum render interval.
| Pipeline Phase | Typical Latency (ms) | Primary Optimization Lever |
|---|---|---|
| Capture | 5 to 15 | Camera hardware, frame rate |
| Encoding | 5 to 30 | Codec choice, hardware acceleration |
| Network Transport | 20 to 80 | TURN proximity, edge SFUs |
| Media Server / SFU | 5 to 30 | Server load, routing complexity |
| Jitter Buffer | 5 to 30 | Playout delay configuration |
| Decoding + Rendering | 7 to 25 | Hardware decode, display refresh rate |
The table above shows that network transport and jitter buffering together account for the largest share of the latency budget. If you only have time to optimize one area, start there.
Real-world latency budgets vary by use case. Telemedicine applications can tolerate up to 200 milliseconds because the interaction is conversational and occasional delays are socially acceptable. Competitive gaming demands sub-100 milliseconds because players react to visual cues in real time. Remote robotics control may require sub-50 milliseconds, which often means deploying media servers at the network edge and using hardware-accelerated pipelines throughout.
Optimization Layers
WebRTC latency optimization happens across three distinct layers: network, media pipeline, and signaling. Each layer has independent levers, and the most effective optimization strategy addresses all three rather than focusing on just one.
Network Layer
Network-layer optimization focuses on reducing the time packets spend in transit between endpoints. The most impactful lever is geographic proximity of TURN servers and SFUs to your users. When a participant in Mumbai connects through a TURN server in Virginia, every packet crosses the Pacific twice. Deploying TURN infrastructure in regions matching your user base can cut 50 to 100 milliseconds from RTT.
ICE candidate selection also matters. WebRTC gathers multiple candidates including host, server-reflexive, and relay types, then selects the best pair. If ICE selects a relay candidate when a direct host-to-host path is available, latency increases unnecessarily. Monitoring which candidate type is active in production helps identify suboptimal routing.
UDP is the transport protocol of choice for WebRTC media because it avoids the head-of-line blocking and retransmission delays inherent in TCP. However, some corporate firewalls block UDP, forcing fallback to TCP relay through TURN. This can double latency. Detecting UDP blocking early and communicating it to users helps set expectations.
Bandwidth shaping through adaptive bitrate algorithms prevents network congestion from cascading into latency spikes. When available bandwidth drops, the encoder should reduce bitrate and resolution before packets start queuing. VideoSDK's network-adaptive streaming handles this automatically, adjusting quality in real time based on detected bandwidth conditions.
Edge SFUs reduce hop count by processing media closer to end users. Instead of routing all traffic through a central region, edge deployments allow participants to connect to a nearby node that forwards media with minimal processing delay.
Media Pipeline Layer
Media pipeline optimization targets the encoding, decoding, and buffering stages where processing time directly adds to latency. Codec selection is the most consequential decision. H.264 remains the most widely supported codec with hardware acceleration on virtually all modern devices, making it a safe default for low-latency applications. VP8 offers comparable latency in software but lacks consistent hardware support across platforms. VP9 provides better compression at low bitrates but can increase encoding latency by 10 to 20 milliseconds without hardware acceleration.
AV1 is the emerging frontier. Real-time AV1 encoders from NVIDIA and other GPU vendors are bringing hardware-accelerated AV1 encoding to production, promising better quality per bit at similar latency to H.264. As of 2026, AV1 hardware encoding support is expanding but not yet universal across mobile devices, so verify hardware support on your target platforms before committing to AV1 as a primary codec.
For audio, the Opus codec is the standard choice. Opus supports low-delay modes that achieve coding delays as low as 5 milliseconds, making it ideal for real-time voice. Configuring Opus with the lowest practical frame size reduces audio pipeline latency without noticeable quality loss.
Hardware acceleration is critical for keeping encode and decode times under 10 milliseconds. On Windows, NVENC and AMF provide GPU-accelerated H.264 and AV1 encoding. On macOS and iOS, VideoToolbox handles hardware encoding. On Android, MediaCodec with hardware flags enables GPU-accelerated paths. Software-only encoding on low-end devices can push frame processing times above 30 milliseconds, consuming a large portion of the latency budget.
Jitter buffer configuration directly trades latency for stability. A minimum playout delay of 20 milliseconds is common for conversational applications. Reducing it to 10 milliseconds saves latency but risks audio glitches on unstable networks. Some SDKs expose jitter buffer tuning through APIs, while others manage it automatically. VideoSDK handles jitter buffer adaptation internally, balancing latency against packet loss recovery based on real-time network conditions.
Adaptive bitrate and simulcast or SVC add complexity but improve the experience for multi-party calls. Simulcast encodes multiple resolution layers simultaneously, letting the SFU forward the appropriate layer to each receiver based on available bandwidth. SVC encodes a single stream with scalable layers, reducing encoder load. Both approaches help maintain low latency for receivers on poor connections without degrading quality for those on good connections.
Signaling and Application Layer
Signaling-layer optimization focuses on reducing session setup time and ensuring ICE negotiation completes quickly. While signaling latency does not affect in-call media latency, it determines how quickly users can join a conversation, which shapes their perception of responsiveness.
Fast ICE negotiation is achievable through pre-fetching ICE candidates before the call begins. By gathering candidates at application startup or when the user navigates to a call screen, the ICE phase can complete in a single round-trip instead of waiting for candidate gathering and exchange.
Minimizing signaling round-trips reduces join latency. Some implementations require multiple offer and answer exchanges before media flows. Consolidating session description protocol negotiation into a single offer and answer pair, combined with pre-gathered candidates, can bring session setup under 500 milliseconds.
Token generation latency also matters. If your authentication server takes 200 milliseconds to generate a JWT, that delay adds to every participant's join time. Generating tokens ahead of time or caching token generation logic in a fast runtime environment keeps this step under 50 milliseconds. VideoSDK's REST API provides room creation and token generation endpoints designed for low-latency server-side orchestration.
Practical Troubleshooting Checklist
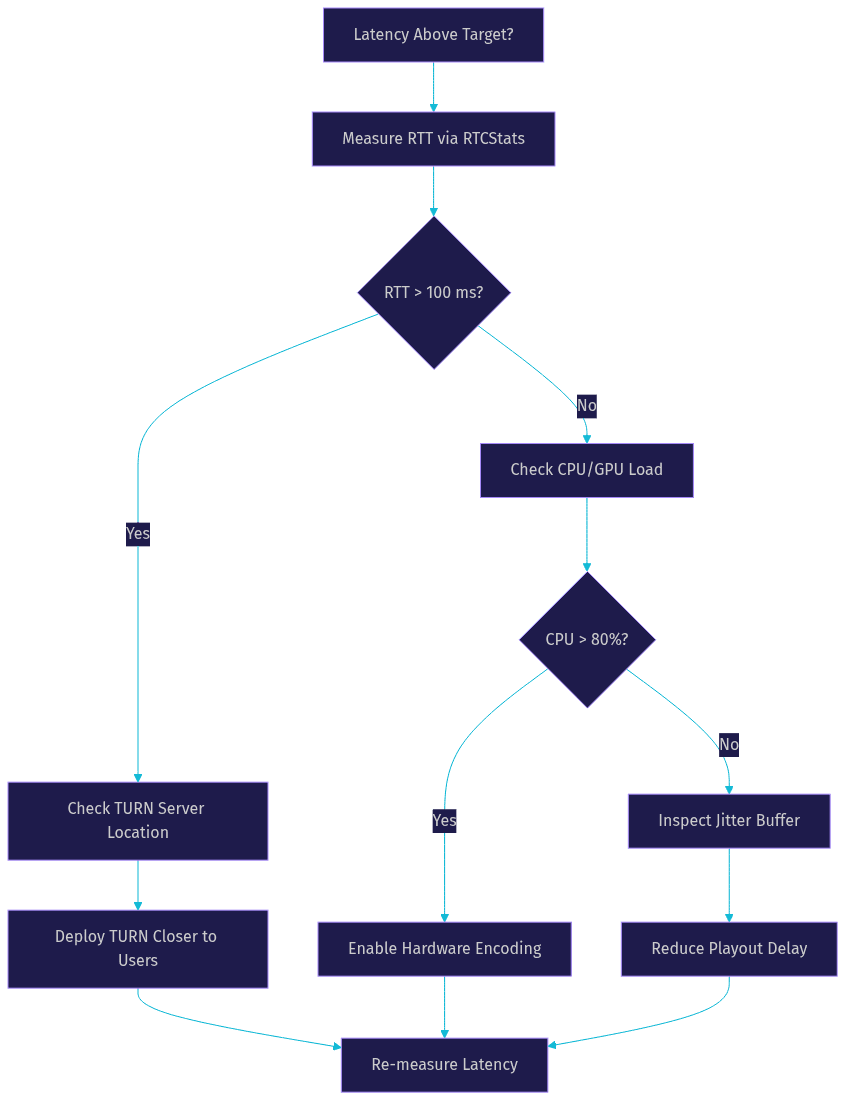
When WebRTC latency exceeds your target budget, a systematic approach beats random tuning. Start by measuring, then isolate the problematic layer, then apply targeted fixes.
First, verify RTT using the RTCStats API. Pull the roundTripTime from outbound RTP stream stats during an active call. If RTT is above 100 milliseconds, the network layer is your primary suspect. If RTT is low but end-to-end latency is high, the problem is in the media pipeline or jitter buffer.
Second, check TURN server latency and geographic proximity. If participants are connecting through a TURN relay in a distant region, every packet adds unnecessary transit time. Compare RTT with and without TURN to quantify the relay penalty.
Third, monitor CPU and GPU load on both endpoints. If CPU usage is above 80 percent during a call, the encoder may be falling behind, causing frames to queue before encoding. This manifests as increased encode time in RTCStats and visible latency on the receiving end. Hardware acceleration can resolve this if available.
Fourth, adjust jitter buffer settings incrementally. If jitter values are low (under 10 milliseconds) but the buffer is configured for 40 milliseconds of playout delay, you are adding unnecessary latency. Reduce the minimum playout delay in small steps and monitor for audio artifacts.
Fifth, inspect codec performance. If you are using VP9 in software on a mobile device, switching to H.264 with hardware encoding can save 15 to 25 milliseconds per frame. Check whether hardware acceleration is active through the encoder implementation stats.
Emerging Trends and Future Directions
The WebRTC latency landscape is evolving as new codecs, transport protocols, and AI-assisted optimization techniques reach production maturity. Real-time AV1 encoding is the most significant near-term shift. NVIDIA's NVENC AV1 hardware encoder and similar offerings from other GPU vendors are bringing AV1's compression efficiency to low-latency pipelines, potentially allowing lower bitrates at the same quality or better quality at the same latency compared to H.264.
WebTransport and QUIC-based media transport represent a longer-term direction. While WebRTC currently relies on UDP and DTLS-SRTP for media transport, QUIC offers multiplexed streams with independent loss recovery, which could reduce head-of-line blocking for media without sacrificing reliability for signaling. The IETF is actively working on specifications for QUIC-based real-time media, though production adoption remains early as of 2026.
AI-assisted latency prediction is another emerging area. Machine learning models trained on network conditions, device profiles, and historical session data can predict latency spikes before they occur, allowing proactive bitrate adjustments rather than reactive ones. Some commercial platforms are beginning to offer predictive network adaptation, though open-source implementations remain limited.
Edge-AI processing for ultra-low latency applications is gaining traction in robotics and remote control scenarios. By running inference on edge nodes close to the media path, applications can process video frames for tasks like object detection without adding a round-trip to a central cloud server. This architecture is particularly relevant for autonomous vehicle teleoperation and industrial remote inspection.
Definitions Glossary
WebRTC Latency: The total one-way delay from media capture at the source to rendering at the destination, encompassing all processing and transport stages in between.
Glass-to-Glass Latency: The most comprehensive latency measurement, starting from the instant a camera sensor captures light to the instant the receiver's screen displays that frame.
Round-Trip Time (RTT): The time for a packet to travel from sender to receiver and back, estimated in WebRTC through RTCP receiver reports and accessible via the RTCStats API.
Jitter Buffer: A buffer on the receiving side that holds incoming media packets to smooth out arrival time variation, directly adding to end-to-end latency.
ICE Negotiation: The process by which WebRTC discovers and selects the optimal network path between two endpoints, using STUN and TURN servers to gather candidate routes.
Adaptive Bitrate: A mechanism that dynamically adjusts video quality based on real-time network conditions to prevent congestion and maintain low latency.
Key Takeaways
- WebRTC latency is the sum of delays across capture, encoding, network transport, media server processing, jitter buffering, and decoding and rendering, with a practical target of sub-200 milliseconds for interactive applications.
- Measuring latency requires tracking RTT, jitter, and codec processing time through the RTCStats API and browser tools like chrome://webrtc-internals, not relying on network ping alone.
- Optimization must address all three layers: network (TURN proximity, edge SFUs, UDP transport), media pipeline (hardware-accelerated codecs, tuned jitter buffers, adaptive bitrate), and signaling (pre-fetched ICE candidates, minimal round-trips).
- VideoSDK's network-adaptive streaming and globally distributed infrastructure handle many of these optimizations automatically, letting developers focus on application logic rather than latency tuning.
- Emerging technologies like real-time AV1 encoding, QUIC-based transport, and AI-assisted latency prediction will further reduce achievable latency in the coming years.
Conclusion
Mastering WebRTC latency is essential for any application where real-time interaction defines the user experience. Whether you are building a telemedicine platform, a live streaming service, or a remote control system, understanding where milliseconds accumulate and how to compress each pipeline phase gives you a measurable competitive advantage. The sub-200 millisecond target is achievable with proper codec selection, geographically distributed infrastructure, and disciplined jitter buffer management.
If you want to skip the infrastructure engineering and ship low-latency video calling immediately, explore VideoSDK's video calling SDK with built-in network-adaptive streaming, or browse code samples for your platform of choice. You can sign up for free at app.videosdk.live/login and start building today.
What are you building with WebRTC? Drop a comment below, I would love to hear what kind of real-time application you are working on and what latency targets you are aiming for.
Free $20 Balance for AI Voice Agents & Video Calls
FAQ