


QoE, or quality of experience, is defined by ITU-T P.10/G.100 as the degree of delight or annoyance of the user of an application or service. For a video call, QoE is the call as the participant actually felt it. VideoSDK reports the session metrics behind that feeling, including jitter, round trip time and packet loss.
Two people finish a call. One says it was fine. The other says the video kept stalling. The graphs for that session look almost identical, because both were on the same office wifi.
That gap is the problem QoE exists to describe. Packet counters tell you what the network did. They do not tell you whether anyone could hold a conversation. This guide covers the QoE definition, how it differs from QoS, the metrics that matter for calls, and the three ways teams measure it with VideoSDK.
What is QoE (quality of experience)?
QoE is defined as the degree of delight or annoyance of the user of an application or service.
That wording is the formal definition in Recommendation ITU-T P.10/G.100, clause 6.209. The Recommendation is the ITU vocabulary for performance, quality of service and quality of experience, and the edition in force is dated November 2017.
QoE works by combining what the system delivered with what the person expected. Clause 6.210 lists the influencing factors. They include the type of application, the context of use, whether the user's expectations were met, cultural background and emotional state.
A blurry frame during a family catch-up is a shrug. The same frame during a remote medical consultation is a failure. That is why QoE cannot be read off a router.
Where the quality of experience definition comes from
The ITU adopted the quality of experience definition from academic work rather than writing it fresh. Clause 6.209 credits the Qualinet White Paper on Definitions of Quality of Experience, produced at the fifth Qualinet meeting in Novi Sad in March 2013.
The Recommendation attaches a note to it. The definition is described as a working one, expected to keep evolving as research continues. Anyone citing a fixed, final QoE definition is overstating the standard.
Standards writers use both word orders. P.10/G.100 heads clause 6.209 with quality of experience QoE, and its abbreviations list reverses that to QoE quality of experience. Both point at the same entry.
QoE vs QoS: What each one measures?
QoS describes what the network delivered. QoE describes what the person got out of it.
Recommendation ITU-T E.800 defines quality of service as the totality of characteristics of a telecommunications service that bear on its ability to satisfy stated and implied user needs. Clause 6.212 of P.10/G.100 repeats that definition and points back to E.800. The two terms live in one vocabulary because one feeds the other.
| QoE | QoS | |
|---|---|---|
| What is measured | How the call felt to the participant | How the network and service performed |
| Who reports it | The user, through a rating or an action | The network, the server and the client SDK |
| Example metrics | MOS, post-call rating, call abandoned, meeting rejoined | Jitter, round trip time, packet loss, bitrate, frame rate |
| Where it is collected | Surveys, in-app rating prompts, product analytics | Client stats APIs, media servers, session dashboards |
| Where it falls short | Small samples, late ratings, users rarely explain why | Green metrics on a call the user hated, no view of expectation |
| How they relate | QoE is the outcome | QoS is the strongest lever you control |
The fifth row is the one that costs teams time. Good QoS numbers do not guarantee good QoE, but bad QoS numbers almost always produce bad QoE. So instrument the technical side heavily, then use a small amount of user feedback to check whether the two pictures agree.
Network quality of experience is only half the picture
The phrase network quality of experience is common, and slightly misleading. The network is one influencing factor among the several that clause 6.210 lists.
A call can be ruined by a saturated uplink. It can equally be ruined by a laptop pinned at 100% CPU, a cheap microphone, an echo, or a badly lit room. Network fixes only move the metrics they touch.
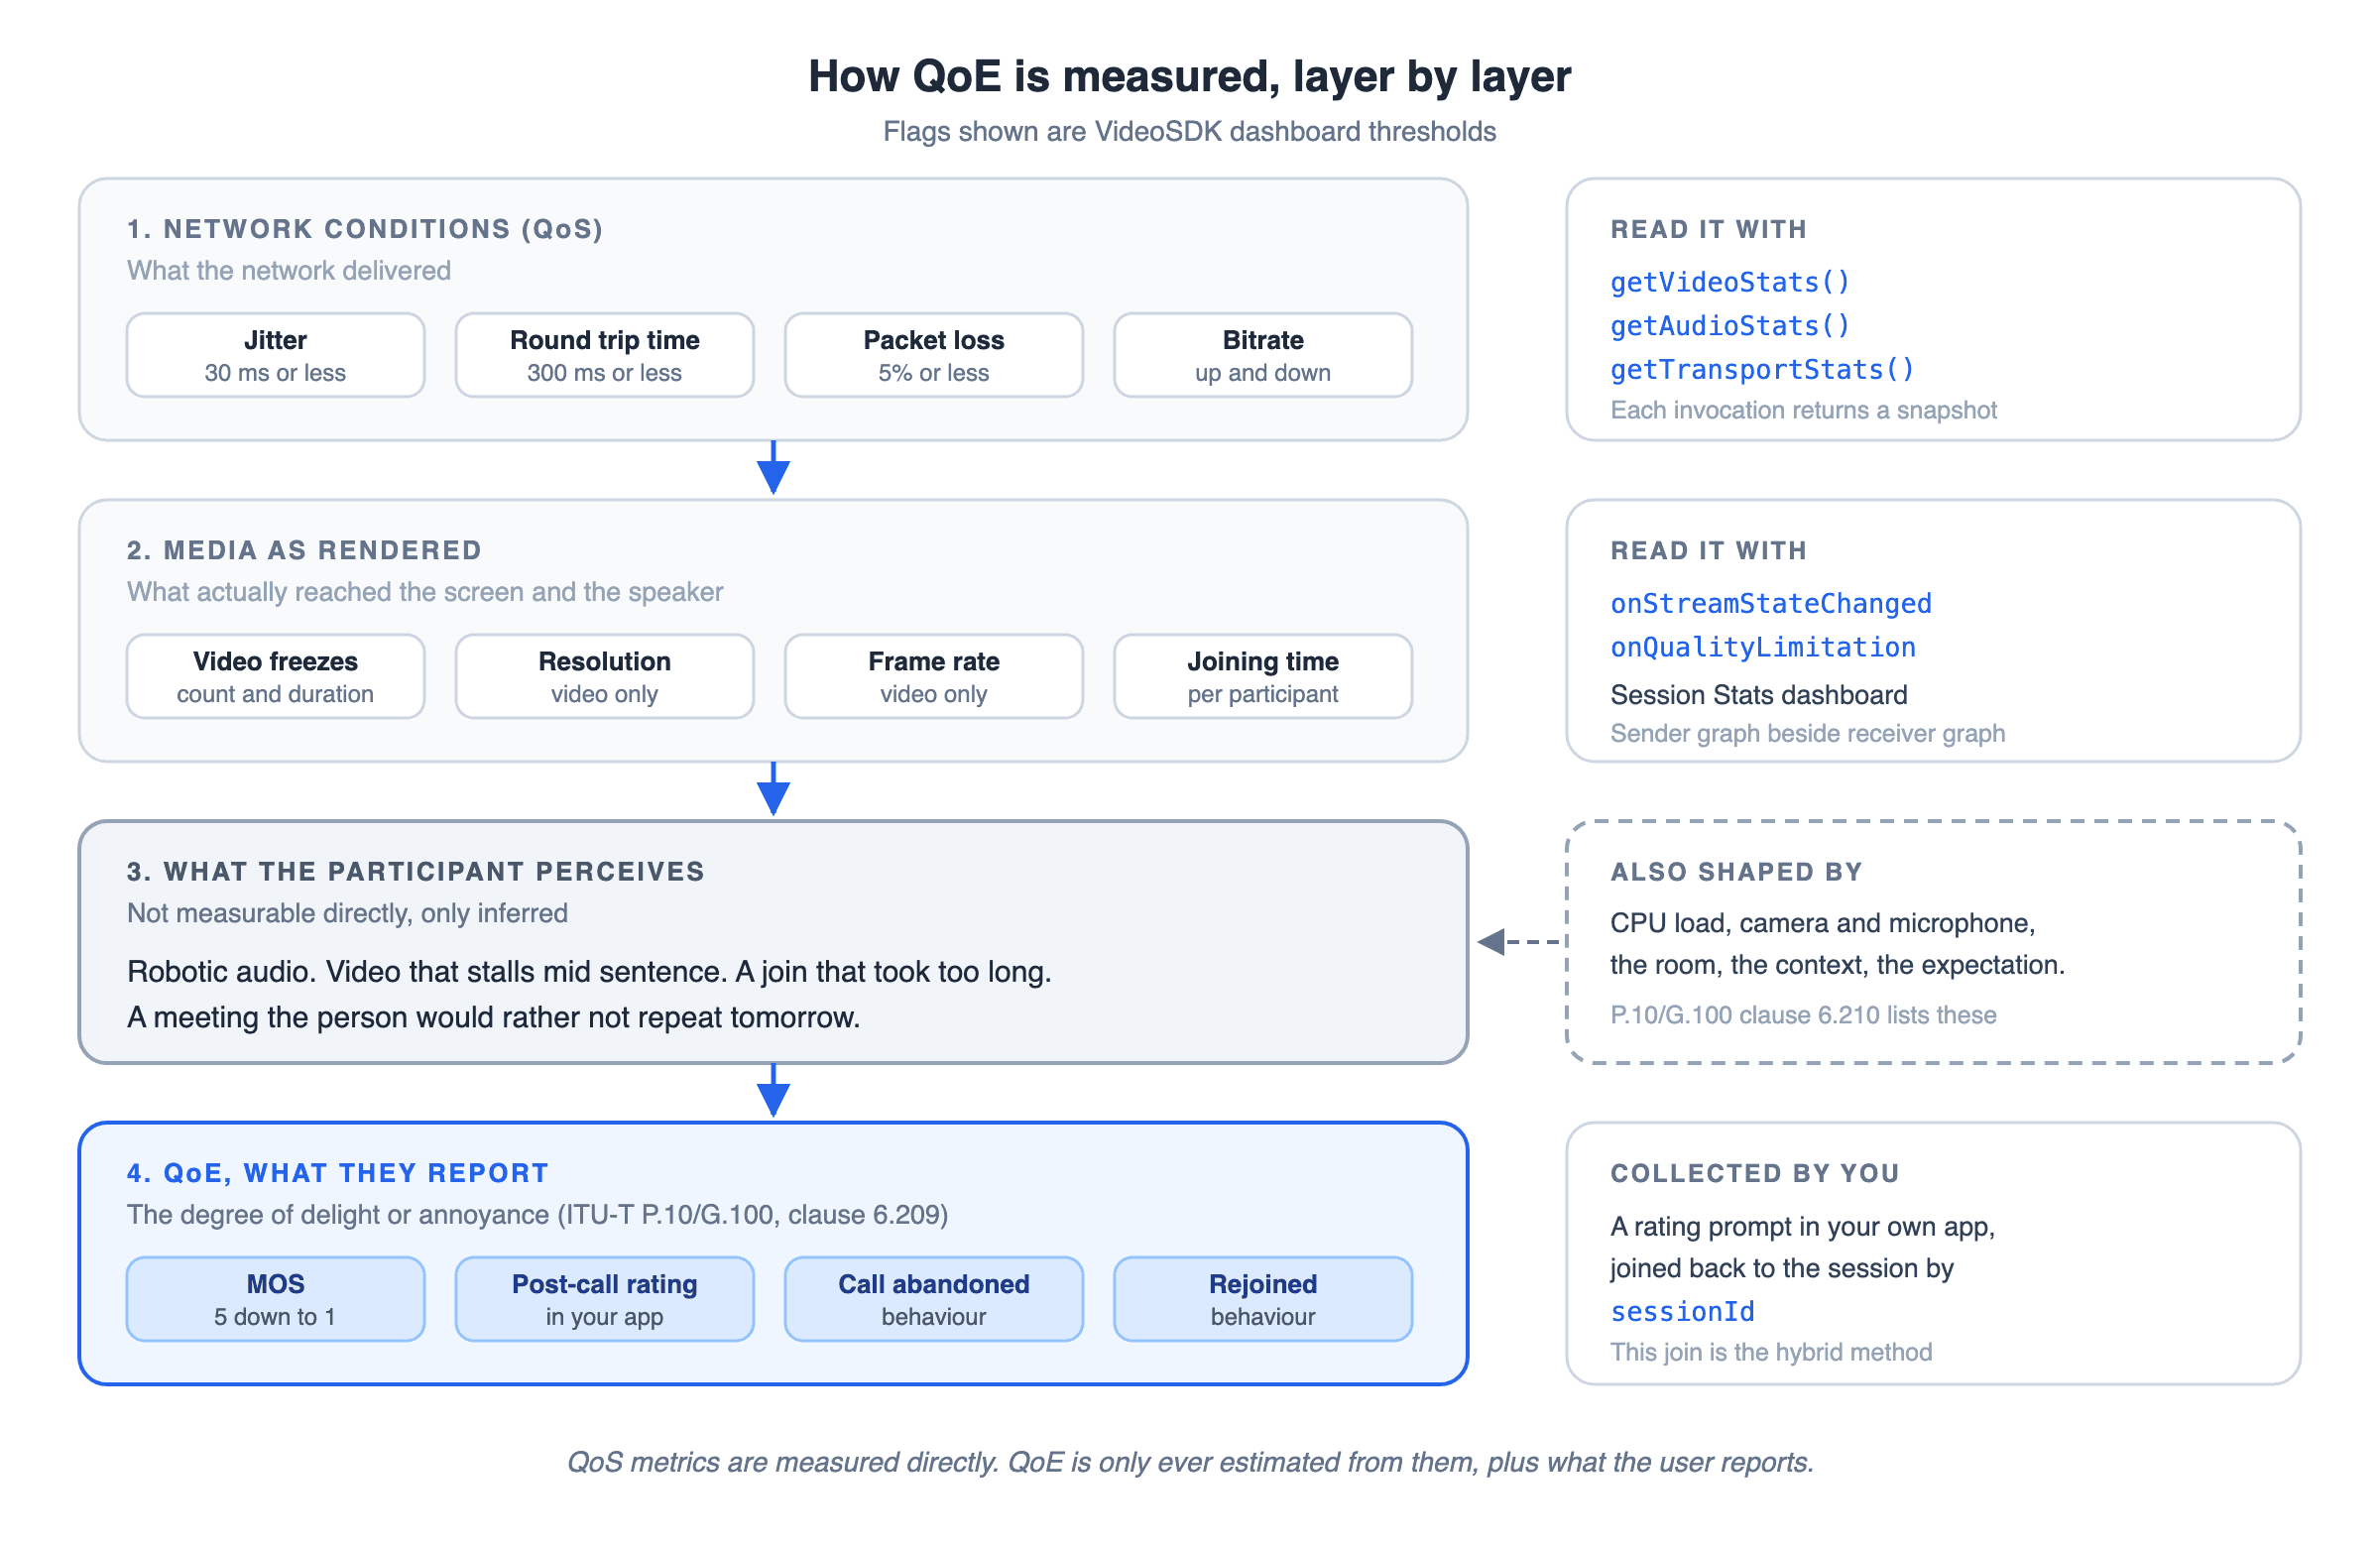
QoE metrics for real-time video
Every QoE metric for a call is either something the user reported or something the client measured while media was flowing.
The metric definitions below come from the W3C specification Identifiers for WebRTC's Statistics API, a Candidate Recommendation Draft dated 25 September 2025. It defers to RFC 3550 for jitter and loss. The flag values come from VideoSDK's analytics dashboard documentation, updated 10 July 2026.
| Metric | What it measures | Documented flag | Source of the flag |
|---|---|---|---|
| MOS | Average of user ratings on a five-point scale | 5 excellent, 4 good, 3 fair, 2 poor, 1 bad | ITU-T P.800, Annex B.4.5 |
| Jitter | Variation in packet arrival, in seconds | 30 ms or less | VideoSDK analytics docs |
| Round trip time | Time for data to reach the server and come back | 300 ms or less | VideoSDK analytics docs |
| Packet loss | Share of RTP packets that never arrived | 5% or less | VideoSDK analytics docs |
| Video freezes | Gap between two consecutively rendered frames | No published threshold, count them per session | W3C webrtc-stats defines the freeze |
| Resolution and frame rate | Sharpness and smoothness, video only | No published threshold, compare sender against receiver | VideoSDK analytics docs |
| Joining time | Time the participant took to establish the connection | No published threshold, watch the distribution | VideoSDK session overview |
| Session errors | Network issues and connection disruptions | Any error is worth reading | VideoSDK Errors tab |
Those three VideoSDK numbers are dashboard triage flags, not service guarantees.
Why a jitter number needs context?
RFC 3550 is unusually direct about the limits of the jitter it defines. It describes the interarrival jitter field as a snapshot at the time of a report, and says it is not intended to be taken quantitatively.
It is meant for comparison, across reports from one receiver over time or across receivers at the same moment. A single jitter reading in isolation proves very little.
The same section gives jitter a job packet loss cannot do. Loss tracks persistent congestion, jitter tracks transient congestion, and jitter can show congestion before it turns into loss. Watching jitter is how you see trouble arriving.
What counts as a video freeze?
Freezes are the one QoE metric with a precise published formula, and almost nobody quotes it.
The W3C webrtc-stats specification defines freezeCount for inbound video. A freeze is counted when the gap between two consecutively rendered frames reaches Max(3 x avg_frame_duration_ms, avg_frame_duration_ms + 150). That average is taken over the last 30 rendered frames.
The threshold is whichever of the two is larger. At 30 frames per second the average frame lasts about 33 ms, so a freeze starts at a gap of about 183 ms. The three-times rule only takes over below about 13 frames per second. The spec pairs the count with totalFreezesDuration, so you can report how often video stalled and for how long.
VideoSDK surfaces the same idea as an event. The onStreamStateChanged callback fires for a remote participant's video or screen share, reporting active, stuck, freeze-detected, freeze-resolved or ended.
How to measure QoE: three methods
There are three practical ways to measure QoE, and production teams end up running all three.
Subjective: MOS from user ratings
The mean opinion score is the oldest QoE measure still in daily use. Recommendation ITU-T P.800, dated August 1996, sets the listening-quality scale in Annex B.4.5. Excellent scores 5, Good 4, Fair 3, Poor 2 and Bad 1, and the arithmetic mean of those scores is the MOS.
Two limits matter before you ship a five-star widget. P.800 describes laboratory methods for speech, under controlled conditions, with screened subjects. Video has its own Recommendation, ITU-T P.910, whose current edition is dated July 2026.
A rating prompt after a call is therefore a MOS-like signal rather than a P.800 MOS. It is still the most direct read you will get on whether the call worked.
Objective: stats from the session
Objective measurement means reading what the client already knows. VideoSDK's call quality guide documents four participant methods: getVideoStats(), getAudioStats(), getShareStats() and getShareAudioStats().
The video and screen share versions return resolution, frame rate, bitrate, jitter, round trip time and packet loss. The audio versions return bitrate, jitter, round trip time and packet loss. A separate getTransportStats() returns aggregate uplink and downlink bitrate in kbps.
Hybrid: ratings joined to stats
The useful measurement is the join. A rating alone says a call was bad. A stats trace alone says the uplink was congested. Together they say that congested uplinks are what your users call bad.
VideoSDK gives you the key for that join. Every session has a sessionId and every participant an ID, both shown in the session overview. A rating captured in your own product can then be matched back to the measured session.
Monitoring QoE in production with VideoSDK
VideoSDK ships session analytics with the platform rather than as a paid add-on.
Sessions appear at app.videosdk.live/sessions, and each opens into four tabs: Session Overview, Session Stats, Traces and Errors. The VideoSDK pricing page lists session metrics and analytics among the free plan's feature highlights, and describes pay-as-you-go as everything in free plus usage charges. New accounts start with $20 free credit.
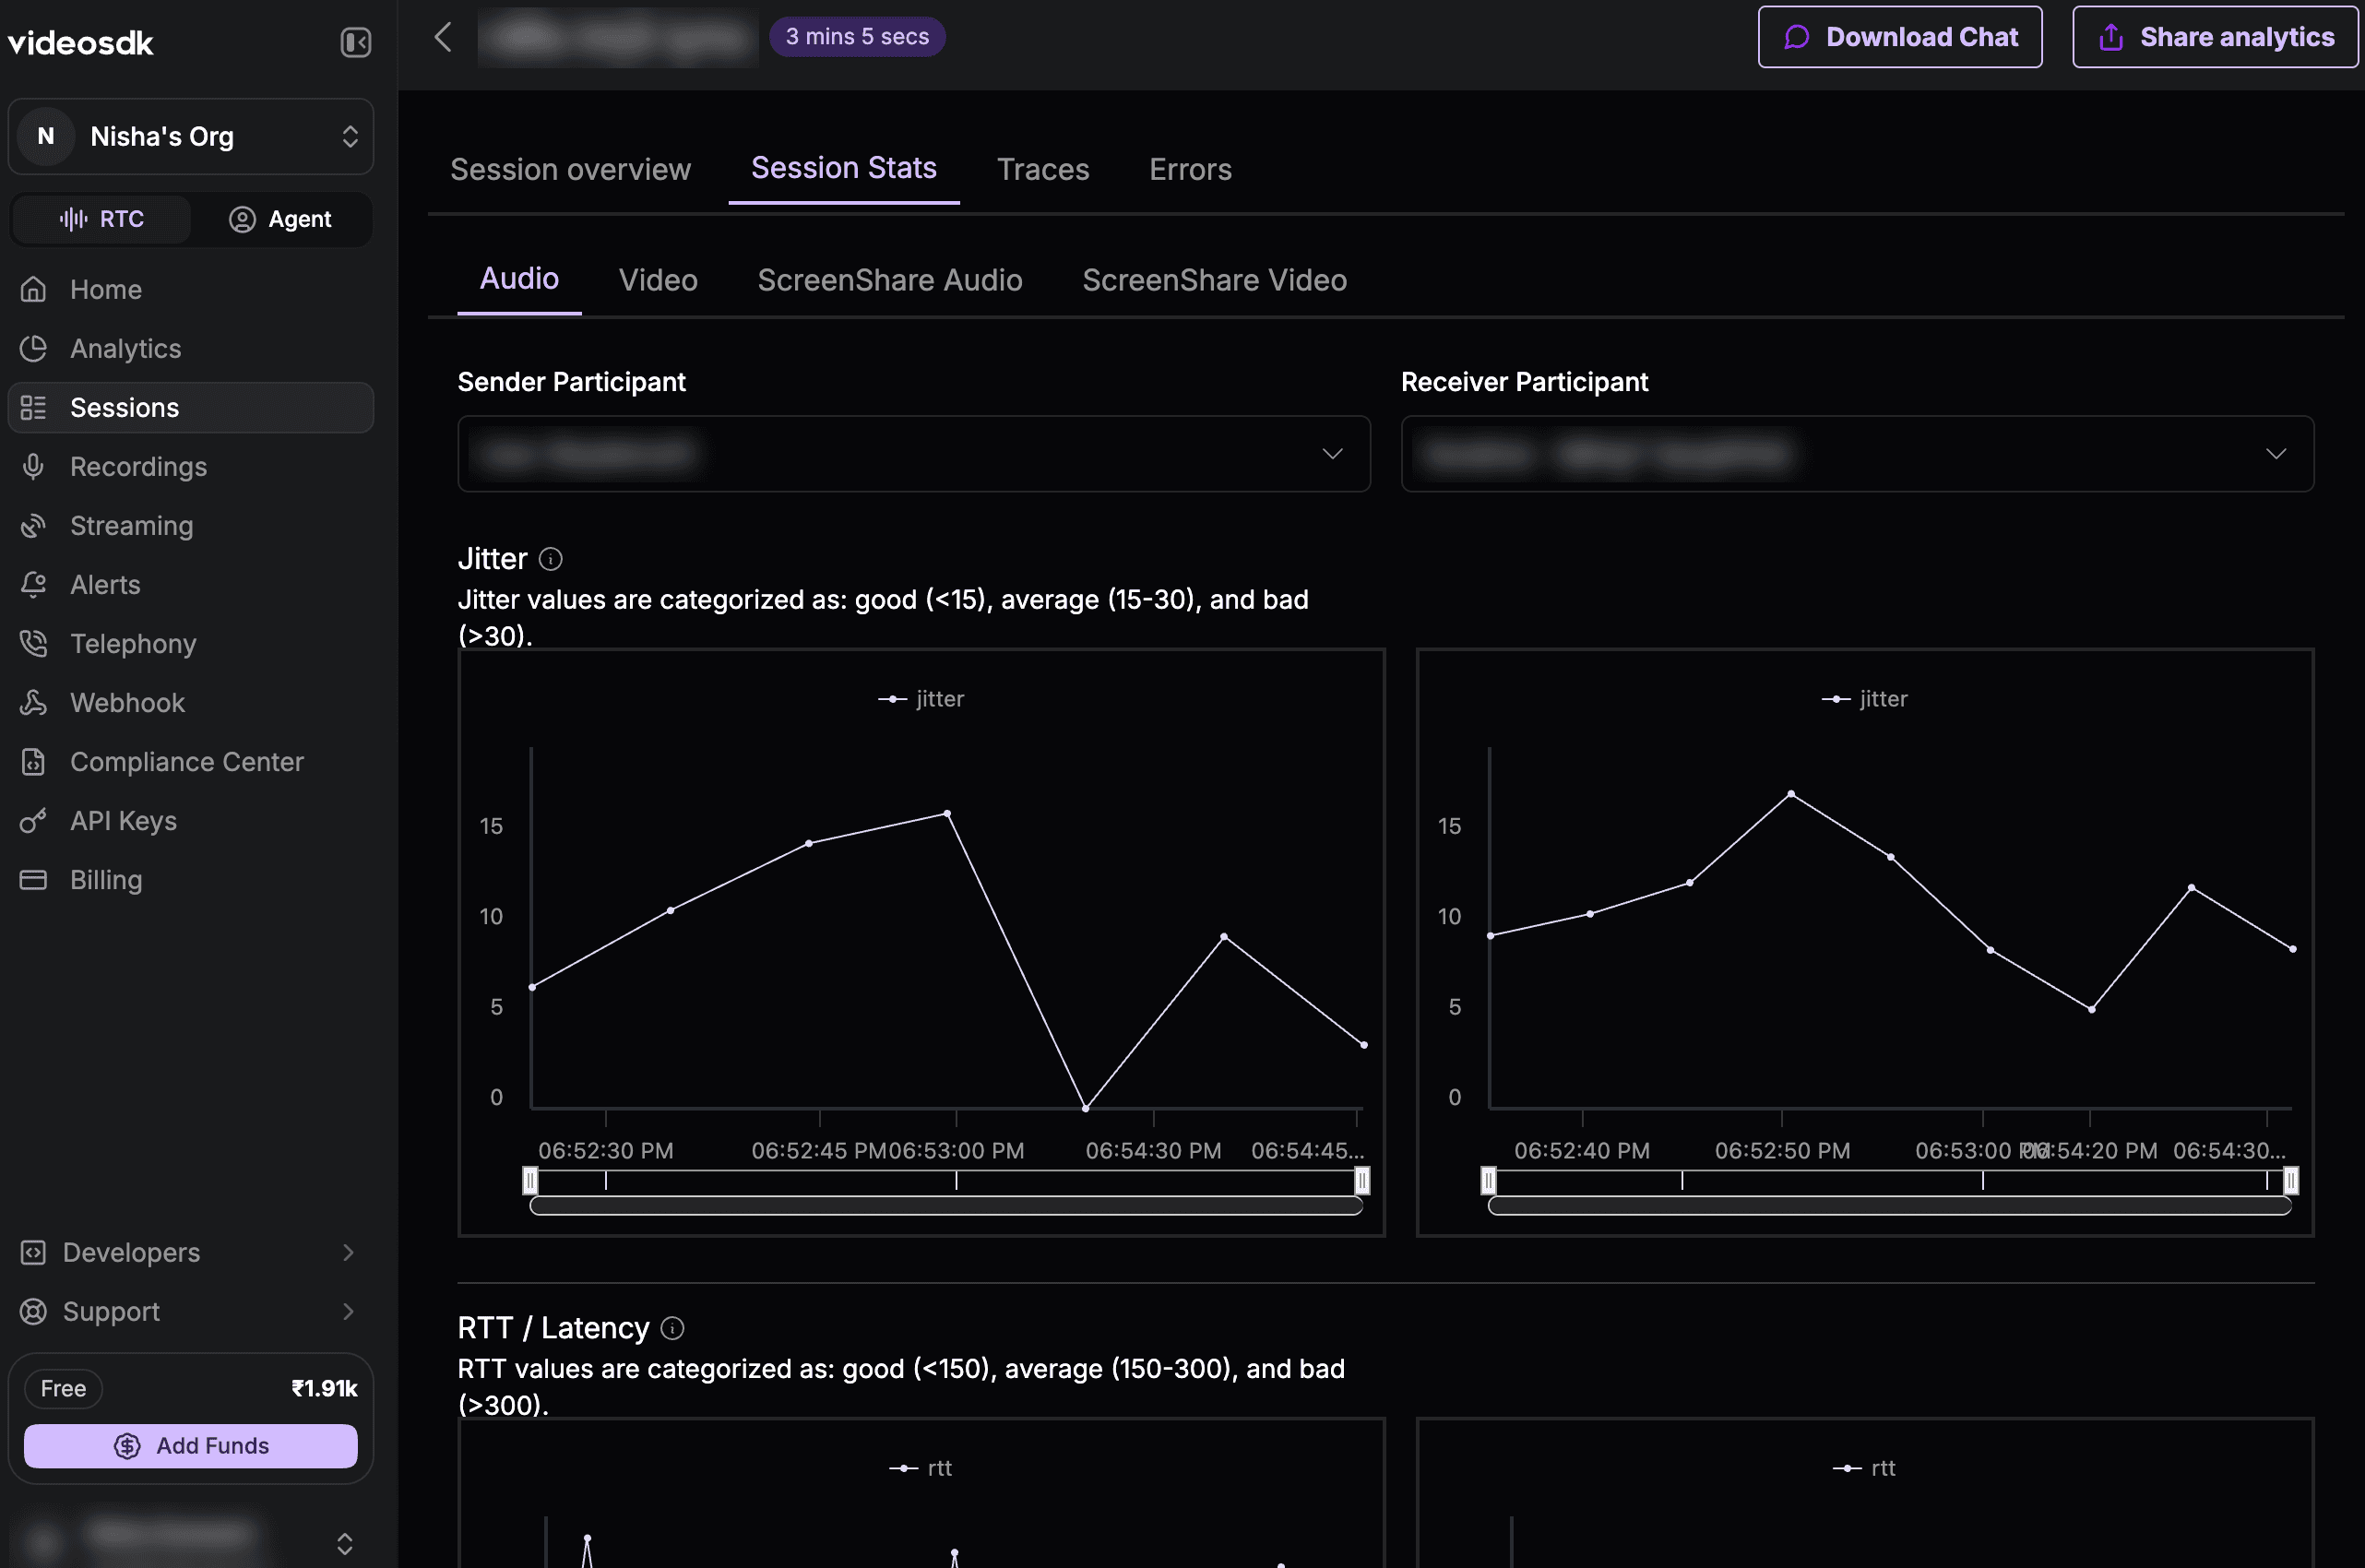
Session Stats is a two-sided view with Audio, Video, ScreenShare Audio and ScreenShare Video sub-tabs. The left side graphs what a selected sender transmitted and the right side graphs what a selected receiver got. Comparing them is how you separate an uplink problem from a downlink problem. The graph captions grade jitter as good (<15), average (15-30) and bad (>30). RTT is good (<150), average (150-300) and bad (>300). The participant view adds a call health bar that scores audio, video and screen share separately in green, orange and red.
That dashboard is a post-call tool. For live reaction, the onQualityLimitation event fires when media quality is limited or recovers. It reports a type of cpu, bandwidth or congestion, plus a state of detected or resolved.
For an outcome example, the healthcare-at-home startup Examedi credits VideoSDK with a 50% reduction in call failures. The quote comes from Rafael Toro, Head of New Business, in the published case study. Treat it as a vendor-published customer testimonial rather than a benchmark.
How do you improve QoE on a video call?
You improve QoE by removing the specific impairment your metrics point at, one at a time.
- Attack jitter before latency. Jitter is what makes audio robotic and video pixelated, and it moves first. Start with What jitter is and how a jitter buffer trades delay for smooth playout.
- Separate bandwidth problems from delay problems. They have different fixes and are routinely confused, which is the subject of bandwidth vs latency.
- Set a bitrate that matches the resolution. Too low looks soft, too high heats phones and starves the uplink. See What bitrate is.
- Choose the codec deliberately. Codec choice changes how much quality survives a given bitrate, covered in video encoding and H.264 vs H.265.
- Subscribe to onQualityLimitation. A
typeofcpumeans drop the resolution. Atypeofbandwidthmeans offer audio only. - Detect freezes instead of guessing.
onStreamStateChangedreportsfreeze-detectedandfreeze-resolved, so you log stalls rather than wait for complaints. - Test the network before the call. VideoSDK's getNetworkStats() method returns download and upload speed in Mb/s, enough to warn a user in advance.
- Show a connection indicator.
getTransportStats()returns one snapshot per invocation, so poll it. Showing good, fair or poor per participant explains an invisible problem.
Building this from scratch means writing your own stats collection and dashboards. The VideoSDK React quickstart gets you a call with those stats methods already attached, and every new account gets $20 free credit.
Definitions glossary
Mean opinion score (MOS): The average of user ratings on the ITU-T P.800 five-point scale, from 5 for Excellent to 1 for Bad. In a VideoSDK app, you collect the rating in your own product and join it to the session.
Jitter: Variation in packet arrival times, defined in RFC 3550 section 6.4.1. VideoSDK's analytics dashboard flags jitter above 30 ms.
Round trip time (RTT): The time data takes to reach the server and come back. VideoSDK returns it fromgetVideoStats()andgetAudioStats(), and its dashboard flags values above 300 ms.
Video freeze: A gap between two rendered frames that reaches the threshold set in the W3C webrtc-stats specification. VideoSDK reports it as thefreeze-detectedstate ofonStreamStateChanged.
Session Stats: The VideoSDK dashboard tab that graphs jitter, RTT, bitrate, packet loss, resolution and frame rate for a chosen sender and receiver. It is where you trace a bad call to an uplink or a downlink.
Key takeaways
- QoE is defined by ITU-T P.10/G.100 as the degree of delight or annoyance of the user, and it is always estimated rather than read directly.
- QoS is what the network delivered and QoE is what the participant took away, so green metrics on a call the user hated is the normal failure mode.
- The metrics worth watching for calls are MOS, jitter, round trip time, packet loss, freezes, resolution, frame rate and joining time.
- VideoSDK documents triage flags of 30 ms jitter, 300 ms round trip time and 5% packet loss.
- Measuring QoE properly means joining a subjective rating to objective session stats, using the session ID as the key.
Conclusion
QoE is the only quality measure that matches what your users actually complain about. Start with the objective side, because VideoSDK already collects jitter, round trip time, packet loss, resolution and frame rate for every session. Add a short rating prompt once you can join it back to a session ID. Grab API keys and $20 free credit and read your first session's stats today.
What does quality of experience look like in your product?
Frequently asked questions
What is a QoE?
A QoE, short for quality of experience, is a measure of how satisfying an application or service felt to the person using it. ITU-T P.10/G.100 defines it as the degree of delight or annoyance of the user. For a video call it covers the audio, the video, the join and the wait.
What is the difference between QoE and QoS?
The main difference is who is being measured. QoS measures the service and the network, using metrics like jitter, round trip time and packet loss. QoE measures the person, using ratings and behaviour. QoS is the lever you control, QoE is the result you are trying to move.
How is QoE measured?
QoE is measured three ways. Subjective measurement collects user ratings and averages them into a MOS, following ITU-T P.800 for speech or ITU-T P.910 for video. Objective measurement reads session stats from the client. Hybrid measurement joins the rating to the stats for one session.
What is a good MOS score?
MOS runs on the five-point scale in ITU-T P.800, where 5 is Excellent, 4 is Good, 3 is Fair, 2 is Poor and 1 is Bad. No single number counts as good across every product, because expectations differ by context. Track the trend in your own app rather than chasing an industry figure.
Is network quality of experience the same as network quality?
No. Network quality is a QoS idea, covering throughput, delay, loss and stability. Network quality of experience describes how those conditions landed with the user, and it also picks up CPU load, device hardware and expectation. Two people on one network can report very different experiences.
Does VideoSDK show QoE metrics for past calls?
Yes. The VideoSDK session analytics dashboard keeps a per-session record with Session Overview, Session Stats, Traces and Errors tabs. Session Stats covers jitter, round trip time, bitrate, packet loss, resolution and frame rate, graphed for sender and receiver side by side.