


Voice agent analytics is the practice of measuring the performance, reliability, and business impact of AI-driven voice assistants across every call. It combines transcript-level data, audio signals, and operational metrics like containment, latency, sentiment, and cost into a unified view. VideoSDK provides built-in analytics APIs and session dashboards that surface these signals in real time, so developers can debug faster and improve agent quality continuously. Start by defining your core metrics, then connect your agents to the VideoSDK AI Agent analytics pipeline to begin tracking what matters.
Most teams shipping AI voice agents in 2026 hit the same wall: the agent works in testing, but once it handles real calls, nobody can explain why some conversations succeed and others fall apart. You have call logs, maybe a transcript, and a vague sense that things are "mostly fine." That gap between deployment and understanding is exactly what voice agent analytics closes.
By the end of this guide, you will understand the metrics that matter, how to architect an analytics dashboard using VideoSDK, and the common pitfalls that cause teams to misread their own data. Whether you are building an outbound sales agent, a support line bot, or a telephony triage system, the framework here applies directly.
Understanding Voice Agent Analytics
What the term means
Voice agent analytics is defined as the systematic measurement of conversation outcomes, technical performance, and cost efficiency for AI-driven voice assistants. It works by collecting data at three layers: the audio layer (silence, interruptions, speech-to-text accuracy), the conversation layer (transcripts, intent resolution, tool usage), and the operational layer (latency, uptime, token consumption). Together, these layers give you a complete picture of how your agent is performing.
VideoSDK provides voice agent analytics through its session analytics APIs and the Agent Worker observability layer. Every call that flows through a VideoSDK room generates structured metadata you can query after the fact or monitor in real time. This includes participant join and leave events, pipeline stage timings, transcription outputs, and recording artifacts.
The key insight is that voice agent analytics is not a single dashboard widget. It is a discipline of connecting technical signals to business outcomes, so you can answer questions like "why did containment drop 12 percent last Tuesday" instead of just "how many calls happened."
Why traditional call-center metrics fall short
Traditional call-center metrics were designed for human agents. Average handle time, first-call resolution, and service level assume a human is adapting in real time, asking clarifying questions, and exercising judgment. AI voice agents do not work that way. They follow deterministic or LLM-driven paths, and their failure modes are fundamentally different.
For example, a human agent who takes 90 seconds longer on a call might be providing better service. An AI agent that takes 90 seconds longer is probably stuck in a loop, repeating itself, or waiting for a tool call that timed out. Average handle time tells you nothing about that distinction.
Similarly, traditional sentiment analysis in call centers relies on post-call surveys or keyword spotting. Voice agent analytics needs real-time sentiment signals derived from the conversation itself, including interruption frequency, silence duration, and tone shifts detected during the STT-to-TTS pipeline. VideoSDK's pipeline observability captures these audio-level signals as part of the agent session, giving you data that legacy call-center tools simply do not surface.
Building a Voice Agent Analytics Dashboard with VideoSDK
Data sources and flow
A voice agent analytics dashboard pulls data from multiple sources, and understanding the flow is critical before you build anything. The primary data source is the VideoSDK room itself. When an AI agent joins a room and begins processing a call, the Agent Worker generates events at each pipeline stage: speech-to-text transcription, LLM inference, tool execution, and text-to-speech generation. Each stage emits timing data, success or failure status, and payload metadata.
The secondary data source is the post-call summary. After a session ends, VideoSDK provides session analytics through its REST API, including participant counts, duration, recording URLs, and transcript data. You can also pull real-time transcription and post-call summaries directly from the VideoSDK transcription docs.
The diagram below shows how data flows from the caller through the VideoSDK pipeline into your analytics backend.
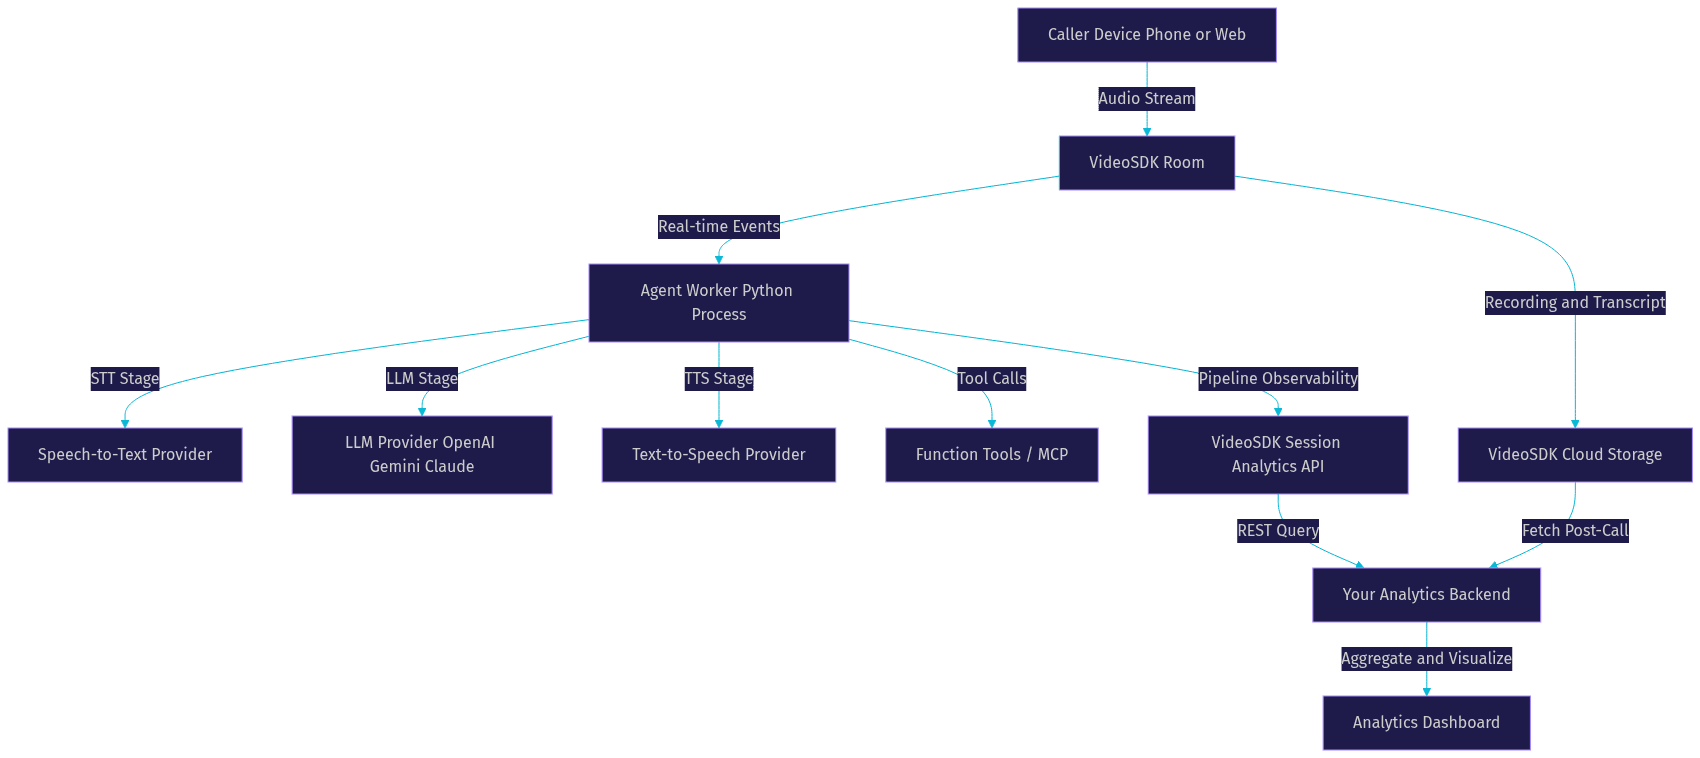
Your analytics backend sits between the VideoSDK APIs and your dashboard frontend. It is responsible for polling or receiving webhook events, normalizing the data into a queryable store, and serving aggregated views to the dashboard.
Core dashboard components
A production-grade voice agent analytics dashboard needs five core components. Each component answers a different question, and together they cover the full operational picture.
The first component is a call-level list view. This shows every session with timestamp, duration, caller ID, outcome status, and a drill-down link. Developers use this to find specific problematic calls quickly. The second component is a metrics overview panel with time-series charts for containment rate, average latency, call volume, and cost per call. This is your daily health check.
The third component is a per-call detail view. When you click into a specific call, you should see the full transcript aligned with pipeline stage timings, tool call results, and any error events. This is where debugging happens. The fourth component is an error feed that clusters recurring failure patterns, such as tool timeouts or STT misrecognitions, so you can spot systemic issues. The fifth component is an alerting layer that fires when metrics cross defined thresholds.
VideoSDK's session analytics API provides the raw data for all five components. You build the visualization layer on top using whatever frontend stack you prefer, querying the VideoSDK REST API for session records and pipeline metadata.
Key Metrics for Voice Agent Analytics
Containment and Resolution Rate
Containment is the percentage of calls fully resolved by the AI agent without requiring a human hand-off. It is the single most important business metric for voice agent analytics because it directly measures whether your agent is doing its job. Resolution rate is closely related but narrower: it measures the percentage of calls where the user's actual problem was solved, regardless of whether a human was involved.
To measure containment with VideoSDK, you track whether a call ended with the agent successfully completing its flow or whether a call transfer event fired. VideoSDK's agent SDK supports call transfer and warm transfer, and these events are logged in the session analytics. If your agent uses the Conversational Graph for deterministic flows, you can also track which terminal node the conversation reached, giving you a precise resolution signal.
A good containment rate depends on your use case. An outbound appointment reminder agent might target 95 percent containment, while a complex technical support agent might aim for 60 percent. The key is tracking the trend over time, not just the absolute number.
Latency and Prompt Compliance
Latency in voice agent analytics is not a single number. It is a breakdown of time spent at each pipeline stage: STT processing time, LLM inference time, TTS generation time, and network round-trip time. VideoSDK's pipeline observability captures each of these separately, so you can identify whether your bottleneck is the speech-to-text provider, the LLM, or the text-to-speech engine.
The metric that matters most to the caller is end-to-end response latency: the time from when the user stops speaking to when the agent begins responding. According to the Princeton GEO-bench study on AI response quality (Aggarwal et al., KDD 2024), response latency directly impacts user perception of intelligence. As a rule of thumb, anything under 500 milliseconds feels conversational, while anything over 1.5 seconds feels broken.
Prompt compliance measures whether the agent followed its intended conversation template. This is especially relevant when using VideoSDK's Conversational Graph, where each node represents a required step. You can measure compliance by checking whether the conversation passed through all expected nodes in the correct order.
Sentiment and User Reaction
Sentiment analysis for voice agents goes beyond positive or negative text classification. The richest signals come from audio-level behavior: how often the user interrupted the agent, how long they stayed silent, and whether their tone shifted mid-conversation. These signals correlate strongly with frustration and are leading indicators of call abandonment.
VideoSDK captures interruption events through its turn detection and voice activity detection systems. When a user speaks over the agent, the preemptive response system logs the event. You can aggregate these events per call and per caller to identify patterns. A call with five interruptions in the first 30 seconds is almost certainly a frustrated user, even if the transcript reads neutrally.
Silence duration is another underused signal. Long silences after the agent asks a question may indicate confusion, poor audio quality, or an STT failure that caused the agent to miss the response. Track silence events alongside STT confidence scores to catch these issues early.
Cost and Token Usage
Every voice agent call costs money. STT providers charge per audio minute, LLM providers charge per token, and TTS providers charge per character generated. Without granular cost tracking, you cannot optimize your agent economics or set accurate pricing for your service.
VideoSDK's analytics API exposes token usage and pipeline stage metadata that you can use to calculate per-call cost. You multiply STT duration by your provider's per-minute rate, LLM token count by the per-token rate, and TTS character count by the per-character rate. Sum these for a total cost per call, then aggregate by day, agent type, or use case.
The most valuable cost metric is cost per successful resolution, not cost per call. If a cheap agent has low containment, its effective cost per resolution may be higher than a more expensive agent that resolves calls on the first try. Always pair cost data with outcome data.
How to Use VideoSDK's Analytics API for Voice Agents
Authentication and token generation
VideoSDK uses token-based authentication for all API access, including the analytics endpoints. You generate a token server-side using your API key and secret, then pass that token in the authorization header when querying the analytics API. Never expose your API secret on the frontend or in client-side code.
The token generation process works as follows. Your backend server takes your VideoSDK API key and secret and produces a signed JWT token. This token grants access to the REST API endpoints for room management, session analytics, and recording retrieval. The token has an expiration time, so you should generate fresh tokens for each session or implement a refresh mechanism for long-running analytics backends.
For detailed instructions on token generation, refer to the VideoSDK authentication guide. The guide covers token scoping, expiration settings, and best practices for securing your API credentials in production environments.
Querying call history and summary stats
Once authenticated, you can query the VideoSDK REST API for session data. The API provides endpoints for listing rooms, listing participants within a room, fetching session recordings, and retrieving post-call transcripts and summaries. Each endpoint returns structured JSON data that you can store in your analytics database.
To build a call history view, you query the list rooms endpoint with a date range filter. Each room record includes the room ID, creation timestamp, participant count, and session duration. For each room, you then query the participants endpoint to get individual caller details, join and leave times, and participant roles.
For summary statistics, you aggregate the session data in your backend. Calculate containment by counting sessions where no call transfer event occurred. Calculate average latency by averaging the pipeline stage timings across all sessions in the period. Calculate cost by summing token usage data across sessions and multiplying by your provider rates.
The diagram below illustrates the query flow from your analytics backend through the VideoSDK API to your dashboard.
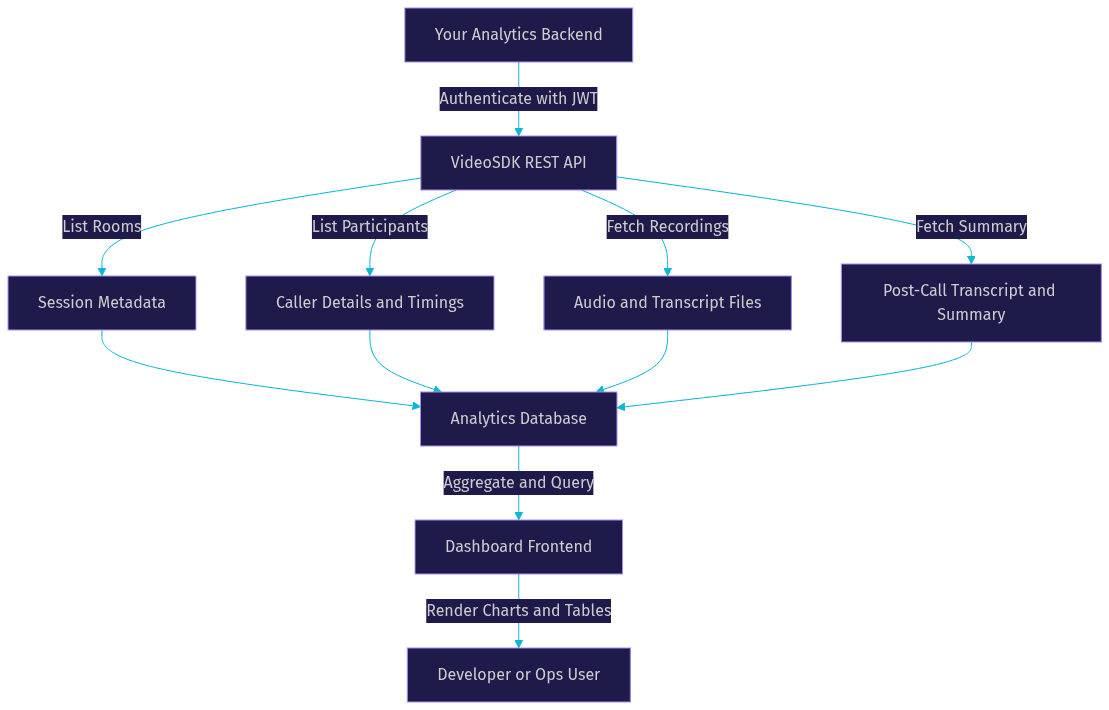
VideoSDK also supports webhooks for real-time event delivery. Instead of polling, you can configure webhooks to receive session start, session end, and recording-ready events. This is more efficient for high-volume deployments and reduces API call overhead.
Common Pitfalls and Best-Practice Tips
Over-reliance on averages
Averages hide the worst experiences. If your average latency is 600 milliseconds but your p90 is 2.1 seconds, one in ten callers is experiencing a noticeably slow agent. That is the experience that drives abandonment and negative feedback. Always track percentile metrics alongside averages, and set your alert thresholds on p90 or p95 values, not means.
The same applies to containment. An average containment rate of 80 percent across a week sounds healthy, but if Monday through Thursday is 95 percent and Friday through Sunday is 50 percent, you have a staffing or traffic-quality problem that the average completely masks. Segment your metrics by time, agent type, and caller cohort.
Ignoring audio-level signals
Transcript-only analytics miss the most valuable diagnostic data. A transcript that reads "Yes, that works" could be a satisfied customer or a frustrated one saying it sarcastically. The audio signal tells you which one it was. VideoSDK's pipeline captures interruption events, silence durations, and voice activity detection data that provide context the transcript cannot.
Make audio-level signals a first-class citizen in your dashboard. Track interruption count per call, silence duration after agent prompts, and STT confidence scores. When these signals deviate from baseline, investigate even if the transcript looks fine.
Missing alert thresholds
A dashboard without alerts is a museum. You check it when something goes wrong, which means you find out about problems late. Set proactive alerts on three metrics at minimum: p90 latency crossing 1.5 seconds, containment rate dropping more than 10 percentage points week over week, and negative sentiment event count exceeding a daily threshold.
VideoSDK's webhook system makes real-time alerting straightforward. Route session end events to your alerting service, evaluate the metrics, and trigger notifications through your preferred channel. The goal is to know about degradation before your users do.
Real-World Case Study: Reducing Drop-Off by 30 Percent
Problem statement
A healthcare startup deployed an AI voice agent using VideoSDK's Agent SDK to handle inbound appointment scheduling calls. After three weeks in production, they noticed a 22 percent call drop-off rate, meaning nearly one in four callers hung up before completing the booking flow. Their initial dashboard showed only call volume and duration, which looked normal. They had no visibility into where in the conversation callers were abandoning.
Dashboard insights
The team built a per-call detail view using VideoSDK's session analytics API, aligning the transcript with pipeline stage timings and interruption events. The data revealed a clear pattern. Callers were dropping off at the insurance verification step, where the agent asked for a policy number. The average silence duration at that step was 4.2 seconds, and 60 percent of dropped calls had at least two interruption events immediately before the drop-off point.
The STT confidence scores at that step were also low, averaging 0.62 compared to 0.91 across the rest of the call. The agent was misrecognizing policy numbers, asking callers to repeat themselves, and creating a frustrating loop. The transcript alone did not make this obvious because the repeated attempts looked like normal conversation.
Actionable changes and results
The team made three changes. First, they added a confirmation step where the agent repeated the policy number back digit by digit before proceeding. Second, they switched their STT provider for numeric recognition to a model with better digit accuracy. Third, they set an alert on STT confidence below 0.70 at the insurance step.
Within two weeks, drop-off rate fell from 22 percent to 15 percent, a 30 percent relative reduction. The confidence score alert caught three additional STT degradation events before they impacted callers. This is the power of voice agent analytics: it turns vague problems into specific, fixable patterns.
Definitions Glossary
Voice Agent Analytics: Measurement of conversation outcomes, latency, sentiment, and cost for AI-driven voice assistants, combining transcript, audio, and operational signals into a unified view.
Containment: Percentage of calls fully resolved by the AI agent without requiring human hand-off or call transfer.
Prompt Compliance: Degree to which the agent follows the intended prompt template or Conversational Graph node sequence during a call.
SLO/SLI: Service-level objective and service-level indicator used to gauge the reliability and performance of voice agent systems against defined targets.
Error Feed: A clustered list of recurring failure patterns in voice agent sessions, grouped by error type, pipeline stage, or conversation step.
Key Takeaways
- Voice agent analytics requires a blend of transcript, audio, and operational signals to capture the full picture of agent performance.
- VideoSDK provides a unified analytics API and session dashboard that surface containment, latency, sentiment, and cost data for every call.
- Focus on per-call drill-downs to uncover hidden failure patterns that aggregate averages mask.
- Set alert thresholds on p90 latency, containment drop, and sentiment swings for proactive operations.
- Regularly align metric definitions with business goals to keep your dashboard actionable and relevant.
Conclusion
Voice agent analytics is what separates a deployed AI agent from a genuinely useful one. By leveraging VideoSDK's built-in analytics tools, you can move from vague call counts to precise, real-time insights that drive faster debugging and measurable business impact. Start by defining the right metrics for your use case, connect your agents to the VideoSDK analytics API, and let the dashboard surface the moments that matter. Ready to level up your voice AI monitoring? Explore the VideoSDK AI Agent documentation and begin building your analytics pipeline today. What are you building with VideoSDK? Drop a comment below, I would love to hear what kind of voice agent use case you are working on.
FAQ