


Measuring voice agent latency means tracking the time from when a user stops speaking to when the agent begins responding, broken down across each pipeline stage. VideoSDK's AI Voice Agent SDK provides built-in pipeline observability that captures per-stage timing, enabling developers to identify bottlenecks and optimize toward the 208 ms human conversation baseline.
Introduction
When a user speaks to a voice agent and hears silence for too long, they assume the system broke. That silence is latency, and it is the single most important quality metric for conversational AI. Research from psycholinguistics shows that human turn-taking gaps average around 208 milliseconds. Exceed that by even 500 milliseconds and users start to notice. Exceed it by a full second and they repeat themselves, talk over the agent, or abandon the call.
This article walks through how to measure voice agent latency with precision. You will learn the key metrics to track, how to instrument your pipeline with observability spans, how to build dashboards and alerts that catch tail latency spikes, and the best practices that compress response times toward human-level performance. Whether you are building a telehealth voice bot, a customer support IVR, or a fintech voice agent, the measurement framework here applies directly.
Understanding Measuring Voice Agent Latency
What is measuring voice agent latency?
Measuring voice agent latency is defined as the systematic process of capturing, analyzing, and reporting the time delays that occur at each stage of a voice AI pipeline, from the moment a user finishes speaking to the moment the agent begins producing audible response audio. It involves instrumenting the pipeline with timestamped spans, aggregating those measurements into statistical distributions, and comparing results against a target threshold such as the human conversation baseline.
Voice agent latency works by breaking the end-to-end response time into discrete, measurable components. Each component, such as speech-to-text processing, LLM inference, or text-to-speech generation, contributes its own delay. By measuring each component independently, developers can pinpoint which stage is responsible for the majority of the total response time and target optimizations accordingly.
VideoSDK provides voice agent latency measurement through its AI Voice Agent SDK, which includes built-in pipeline observability that automatically captures timing data for each stage of the conversation pipeline. The Agent Worker, a Python process that manages sessions inside VideoSDK Rooms, records timestamps as audio flows through speech-to-text, LLM reasoning, and text-to-speech synthesis, making the data available for real-time monitoring and post-call analysis.
Human conversation baseline: the 208 ms turn-taking gap
Human conversations follow a remarkably consistent rhythm. According to research published in psycholinguistics literature, the average gap between one speaker finishing and the next beginning is approximately 208 milliseconds. This is the benchmark that voice agents must approach to feel natural and conversational.
When a voice agent takes 800 milliseconds or more to respond, users perceive the interaction as sluggish. At 1.5 seconds or above, the experience feels broken. The 208 ms baseline is not just an academic curiosity. It is the target that every stage in your pipeline must collectively hit, and measuring how far you deviate from it is the foundation of voice agent performance engineering.
Key Metrics for Measuring Voice Agent Latency
Every voice agent pipeline consists of sequential stages, and each stage introduces its own delay. To measure voice agent latency effectively, you need to track both the aggregate end-to-end time and the individual component times that make up that total.
End-to-end latency vs component latency
End-to-end latency is the total time from when the user stops speaking to when the first audio byte of the agent's response reaches the user's speaker. This is the number users actually experience. Component latency breaks that total into per-stage measurements, letting you see exactly where time is spent.
Without component-level measurement, a latency problem is a black box. You know the agent is slow, but you cannot tell whether the bottleneck is in speech-to-text processing, LLM time-to-first-token, or text-to-speech generation. Measuring both end-to-end and component latency gives you the full picture and tells you where to focus optimization effort.
Per-stage metrics that matter
The key per-stage metrics for voice agent latency include endpointing delay, which is the time your voice activity detection system takes to determine the user has finished speaking. Speech-to-text latency measures how long the transcription provider takes to return final text after audio arrives. LLM time-to-first-token measures the delay before the language model produces its first output token. Text-to-speech time-to-first-byte measures how quickly the TTS provider begins streaming audio after receiving text. Tool-call latency tracks the time spent waiting for external function calls to return. First-audio latency is the time from LLM first token to the first audio byte reaching the user.
Each of these metrics tells a different story. A high endpointing delay suggests your VAD threshold is too conservative. A high LLM TTFT points to model loading or queueing issues. A high TTS TTFB suggests the provider is not streaming or the connection is slow. Measuring voice agent latency at this granularity transforms debugging from guesswork into targeted engineering.
Percentile reporting and tail latency
Averages lie. If your voice agent has a mean latency of 600 milliseconds but a p99 of 2.4 seconds, one in every hundred users experiences a painfully slow response. Percentile reporting, specifically p50, p95, and p99, gives you the full distribution.
P50 tells you the median experience. P95 captures the tail where most performance problems live. P99 reveals the extreme outliers that cause user abandonment. For voice agents, p95 is the most actionable metric because it captures the experience of users who are already having a worse-than-average interaction without being dominated by rare infrastructure failures.
How to choose the right SLA thresholds
Setting SLA thresholds for voice agent latency depends on your use case. A customer support IVR can tolerate higher latency than a real-time tutoring agent. A telehealth voice bot handling appointment scheduling has different requirements than a fintech agent processing transactions.
A practical framework is to set your p95 target at no more than 1.2 seconds for general conversational agents, and under 800 milliseconds for high-interaction scenarios. Your p99 should remain under 2 seconds to prevent the worst-case experience from driving abandonment. Document these thresholds, instrument your pipeline to measure them continuously, and alert when they are breached.
Instrumenting Your Stack to Measure Voice Agent Latency
Instrumentation is where measurement becomes real. Without proper span definitions and timestamp capture, your latency data is guesswork. The goal is to create a trace for every user turn that shows exactly how time was spent across each pipeline stage.
Selecting observability tools
Several observability platforms work well for voice agent latency measurement. OpenTelemetry is the industry standard for distributed tracing and works with most backends including Jaeger, Datadog, and Grafana Tempo. Langfuse specializes in LLM observability and captures token-level timing. For VideoSDK AI Voice Agents, the built-in pipeline observability captures stage-level timing automatically, reducing the need for custom instrumentation.
The right choice depends on your stack. If you are already using OpenTelemetry for other services, extending it to your voice agent pipeline keeps everything in one place. If your focus is purely on LLM interactions, Langfuse provides deeper model-level insights. VideoSDK's built-in observability covers the voice-specific stages that general-purpose tools miss.
Defining spans for each pipeline stage
Each stage of your voice agent pipeline should have its own span with a clear start and end timestamp. The spans should cover audio capture, VAD endpointing, STT processing, LLM inference including time-to-first-token and full response, TTS generation including time-to-first-byte, and audio playback buffer fill.
The key principle is that spans should not overlap in ways that cause double-counting. Streaming STT and LLM processing can overlap, and you need to decide whether to measure them as sequential or parallel stages. The most accurate approach is to measure the wall-clock time from the start of each stage to the start of the next, which naturally accounts for overlap.
Capturing timestamps at consistent clock sources
Clock skew is a silent killer of latency measurement accuracy. If your STT provider runs on a different server than your LLM, and you are comparing timestamps from both, network time protocol drift can introduce errors of tens or hundreds of milliseconds.
Use a single clock source for all timestamps within your agent worker process. When measuring external provider latency, capture the timestamp on your side when the request is sent and when the response is received, rather than relying on provider-reported timestamps. This gives you wall-clock latency that includes network round-trip time, which is what the user actually experiences.
Avoiding double-counting with overlapping streams
Voice agent pipelines often use streaming to reduce perceived latency. STT streams partial transcripts while the user is still speaking. The LLM may begin processing before STT finalizes. TTS may start generating audio from the first LLM tokens before the full LLM response completes.
This overlap is good for performance but tricky for measurement. The solution is to define each span's boundaries clearly. Measure STT latency as the time from final audio frame to final transcript, not from first audio frame. Measure LLM latency as time from prompt submission to first token, and separately from first token to last token. Measure TTS latency as time from first text chunk sent to first audio byte received. This prevents overlapping operations from inflating your total.
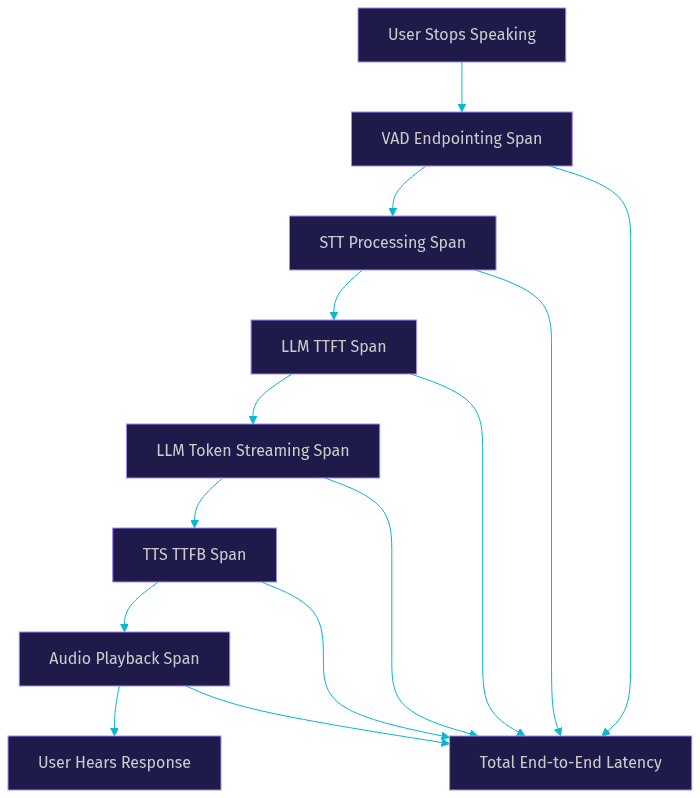
[LINKABLE ASSET: pipeline span diagram]
Monitoring and Alerting for Voice Agent Latency
Measurement without monitoring is just data collection. To keep your voice agent performant in production, you need dashboards that visualize latency distributions and alerts that notify you when performance degrades.
Building dashboards that show per-stage latency distributions
A well-designed latency dashboard shows more than a single number. It displays the p50, p95, and p99 for each pipeline stage, lets you filter by region, provider, and time window, and includes a histogram showing the full distribution of end-to-end latency.
The most useful dashboards also show latency trends over time, making it easy to spot gradual degradation before it crosses your SLA threshold. A spike in STT latency that correlates with a provider deployment, or a gradual increase in LLM TTFT that tracks with growing context windows, are patterns that only become visible with time-series visualization.
Setting alerts on p95 tail spikes and barge-in latency
Alerts should focus on the metrics that directly impact user experience. A p95 latency alert that fires when end-to-end response time exceeds your SLA threshold for more than five consecutive minutes catches sustained degradation without noise from single-request outliers.
Barge-in latency, the time it takes the agent to stop speaking when a user interrupts, deserves its own alert. High barge-in latency means users who try to correct the agent mid-sentence end up talking over it, which is one of the most frustrating voice agent experiences. Set a separate p95 threshold for barge-in, typically under 300 milliseconds.
Correlating latency spikes with external factors
When latency spikes, the cause is often external. A cloud provider region experiencing degraded performance, an STT provider rolling out a new model version, or a sudden increase in concurrent calls can all cause latency to jump.
Your monitoring stack should correlate latency data with contextual metadata. Track the region of each call, the STT and TTS provider used, the LLM model version, and the concurrent call count. When a spike occurs, this metadata lets you quickly determine whether the problem is in your code, your provider, or your infrastructure.
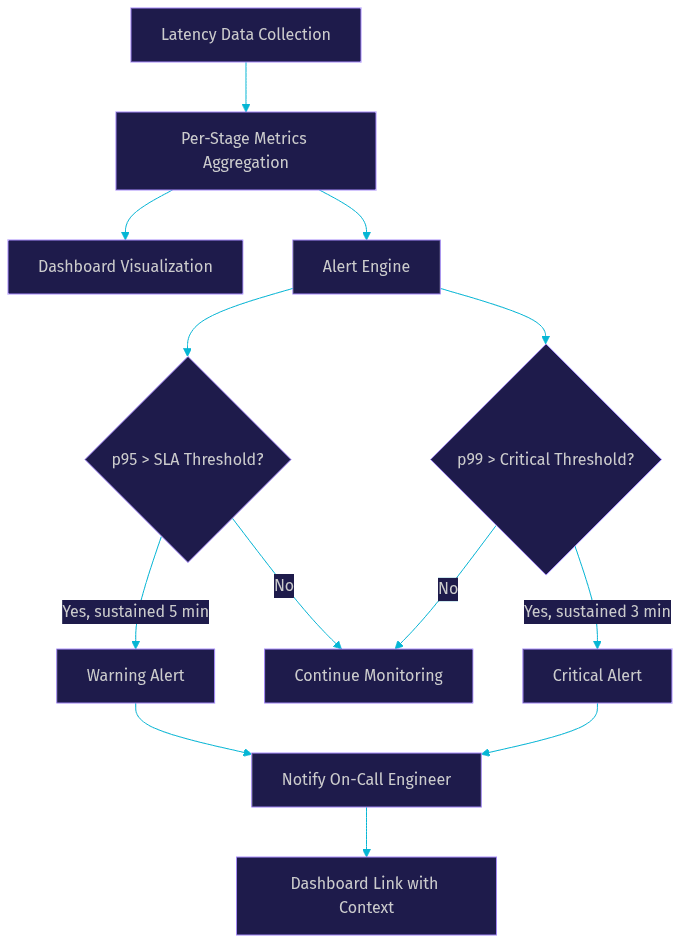
Example alert rule narrative
A practical alert for voice agent latency works as follows. When the p95 end-to-end latency for any pipeline stage exceeds its defined threshold for five consecutive minutes, trigger a warning notification to the on-call engineer. If the p99 exceeds its threshold for three consecutive minutes, trigger a critical alert. Include the affected stage, the current p95 and p99 values, the threshold, and a link to the dashboard filtered to the relevant time window. This gives the responder enough context to start debugging without having to query the system first.
Best Practices for Reducing Voice Agent Latency
Measuring latency is only the first half of the equation. Once you know where time is spent, you can apply targeted optimizations to each stage. The following best practices are grounded in production experience with voice agent pipelines.
Keep audio buffers shallow and use jitter buffers wisely
Deep audio buffers smooth out network jitter but add latency. For voice agents, where every millisecond counts, keep your capture buffer as shallow as your network reliability allows. A jitter buffer of 20 to 40 milliseconds is typically sufficient for WebRTC connections over reasonable networks.
If you are using VideoSDK's WebRTC infrastructure, the built-in network-adaptive streaming handles buffer sizing automatically based on real-time network conditions. For telephony integrations via SIP, pay attention to the jitter buffer configuration on your SIP gateway, as excessive buffering there can add 100 milliseconds or more before audio even reaches your agent pipeline.
Prefer streaming STT and token-by-token LLM output
Batch processing is the enemy of low latency. If your STT provider waits for the user to finish speaking before returning any text, you are adding the full duration of the user's utterance to your latency budget. Streaming STT returns partial transcripts as the user speaks, letting your downstream pipeline prepare or even begin processing before the user finishes.
Similarly, LLM token-by-token streaming means the first token arrives within hundreds of milliseconds rather than waiting for the full response. That first token can be sent to TTS immediately, meaning the user hears the beginning of the response while the LLM is still generating the rest. Providers like OpenAI, Anthropic, and Google all support streaming output, and VideoSDK's AI Agent SDK is designed to wire these streaming interfaces together with minimal overhead.
Warm up LLM requests and keep connections alive
Cold starts are a major source of latency variance. The first request to an LLM after a period of inactivity can take significantly longer than subsequent requests due to connection establishment, model loading, and cache warming.
Send periodic warm-up requests to your LLM provider during low-traffic periods to keep connections alive and caches warm. If you are using a self-hosted model, ensure the model stays loaded in GPU memory between calls. VideoSDK's Agent Worker maintains persistent connections to configured providers, reducing the cold-start penalty that affects ad-hoc API calls.
Cache TTS pre-ambles and use low-latency providers
Many voice agents begin responses with predictable phrases. Acknowledgment words like "let me check that for you" or "I understand" are common pre-ambles that can be pre-generated and cached as audio files. When the agent needs to respond, it plays the cached audio immediately while the LLM and TTS process the substantive part of the response.
For the non-cached portions, choose TTS providers optimized for low time-to-first-byte. According to Artificial Analysis, providers like Cartesia Sonic and ElevenLabs achieve sub-200 millisecond TTFB on streaming requests. VideoSDK's AI Agent SDK supports multiple TTS providers, letting you switch based on latency performance without changing your pipeline logic.
Profile tool-call latency and introduce async fall-backs
Voice agents that call external tools, such as database lookups, API calls, or RAG retrieval, often spend significant time waiting for those calls to return. This tool-call latency is frequently overlooked because it happens outside the core STT-LLM-TTS pipeline.
Profile each tool call separately and set timeout thresholds. If a database lookup takes more than 500 milliseconds, have a fall-back response ready. For example, a brief acknowledgment can play while the tool call completes in the background. VideoSDK's Conversational Graph supports parallel tool calling with fan-out and fan-in patterns, letting you execute multiple tool calls concurrently and proceed when the first result arrives rather than waiting for all calls to complete.
Real-World Example: Optimizing a Telehealth Voice Bot
Consider a healthcare startup building a telehealth voice bot that handles appointment scheduling and symptom triage. The bot uses VideoSDK's AI Voice Agent SDK with Deepgram for STT, OpenAI GPT-4o for the LLM, and ElevenLabs for TTS, all connected through a telephony SIP integration so patients can call in from any phone.
Baseline numbers
Before optimization, the team measured a p95 end-to-end latency of approximately 1.6 seconds. The breakdown showed endpointing delay at 280 milliseconds, STT processing at 220 milliseconds, LLM TTFT at 450 milliseconds, TTS TTFB at 180 milliseconds, and audio playback buffer fill at 470 milliseconds. The audio buffer was the surprise culprit, consuming nearly 30 percent of the total latency budget.
Instrumentation steps taken
The team used VideoSDK's built-in pipeline observability to capture per-stage timing data, supplemented with OpenTelemetry spans for the external tool calls that checked appointment availability. They built a Grafana dashboard showing p50, p95, and p99 for each stage, filtered by call region and time of day.
Latency improvements after tuning each stage
First, they reduced the audio playback buffer from 470 milliseconds to 120 milliseconds by switching to a streaming audio approach that played chunks as they arrived. This alone cut p95 latency by 350 milliseconds. Next, they enabled streaming STT, which reduced the effective STT latency by 90 milliseconds because partial transcripts were available before the user finished speaking. They warmed up the LLM connection with periodic keepalive requests, reducing TTFT variance and bringing the p95 from 450 milliseconds down to 310 milliseconds. Finally, they cached three common pre-ambles as pre-generated TTS audio, which eliminated TTS TTFB entirely for the first 1 to 2 seconds of many responses.
After all optimizations, the p95 end-to-end latency dropped to 720 milliseconds, a 55 percent reduction. The p99 dropped from 2.8 seconds to 1.4 seconds.
Lessons learned
The biggest lesson was that the audio buffer, not the LLM, was the primary latency source. Without per-stage instrumentation, the team would have spent time optimizing LLM inference when the real fix was in the audio pipeline. This pattern applies across domains. Fintech voice agents, customer support bots, and education tutors all benefit from the same systematic measurement approach: instrument every stage, measure percentiles, and optimize the slowest component first.
Definitions Glossary
Turn-taking gap: The silence between one speaker finishing and the next beginning. Human conversation averages 208 milliseconds. Voice agents aim to approach this baseline to feel natural.
Time-to-first-token (TTFT): The delay between submitting a prompt to an LLM and receiving the first output token. A critical metric for voice agent responsiveness because the first token gates TTS generation.
Time-to-first-byte (TTFB): The delay between sending text to a TTS provider and receiving the first byte of audio. Determines how quickly the agent can begin speaking after the LLM produces output.
p95 latency: The latency value below which 95 percent of requests fall. Captures the tail of the distribution where most user-experienced performance problems live.
Pipeline span: A timestamped segment of a distributed trace that represents one stage of the voice agent pipeline, such as STT processing or TTS generation. Spans are the building blocks of latency measurement.
Key Takeaways
- Measuring voice agent latency requires tracking both end-to-end response time and per-stage component latency to identify bottlenecks accurately.
- Percentile reporting, especially p95 and p99, reveals tail latency problems that averages hide and that directly cause user abandonment.
- VideoSDK's AI Voice Agent SDK provides built-in pipeline observability that captures per-stage timing automatically, reducing the need for custom instrumentation.
- The 208 millisecond human turn-taking gap is the benchmark for natural conversation, and every millisecond beyond it degrades perceived quality.
- Systematic instrumentation followed by targeted optimization of the slowest stage, as demonstrated in the telehealth example, can cut p95 latency by more than 50 percent.
Conclusion
Measuring voice agent latency is not a one-time task but a continuous discipline. Instrument every pipeline stage, track percentiles not just averages, build dashboards that surface tail latency, and alert on the metrics that correlate with user frustration. The difference between a voice agent that feels natural and one that feels broken is often a few hundred milliseconds, and you cannot optimize what you do not measure.
VideoSDK's AI Voice Agent SDK gives you the observability foundation to measure latency at every stage, from VAD endpointing through TTS audio delivery. Combined with the Conversational Graph for deterministic flow control and telephony integration for phone-based agents, you have a complete platform for building, measuring, and optimizing production voice AI. Explore the code samples to get started, and join the VideoSDK Discord community to share your latency optimization wins.
What are you building with VideoSDK? Drop a comment below. I would love to hear what kind of voice agent use case you are working on and what latency targets you are aiming for.
Free $20 Balance for AI Voice Agents & Video Calls
FAQ